Sidebar 3: Measurements
I measured the Mark Levinson No.526's electrical performance with my Audio Precision SYS2722 system (see the January 2008 "As We See It"). Looking first at the No.526's performance as a line preamplifier, the gain with the volume control set to its maximum of "80" was 13.5dB, balanced input to balanced output; and 7.5dB, unbalanced input to unbalanced output. The unity-gain setting was "66.7" on the front-panel display. Both sets of inputs preserved absolute polarity (ie, were non-inverting). The balanced inputs offered an input impedance of 47k ohms across the audioband, while the unbalanced input impedance was 44k ohms at low and middle frequencies, dropping inconsequentially to 31.5k ohms at 20kHz. The output impedances from 20Hz to 20kHz were 150 ohms balanced and 75 ohms unbalanced. The front-panel headphone jack offered a maximum gain of 7.5dB, and with the output impedance set to Low, the impedance was a very low 2.7 ohms across the audioband. Set to High, the impedance measured 76 ohms.
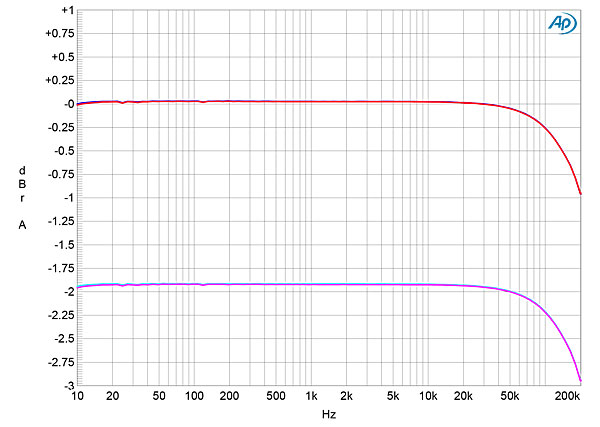
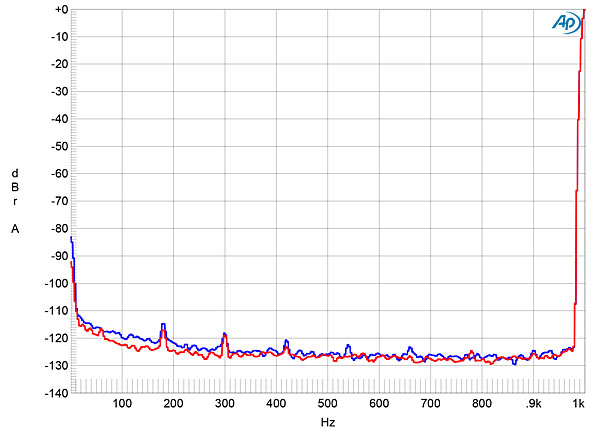
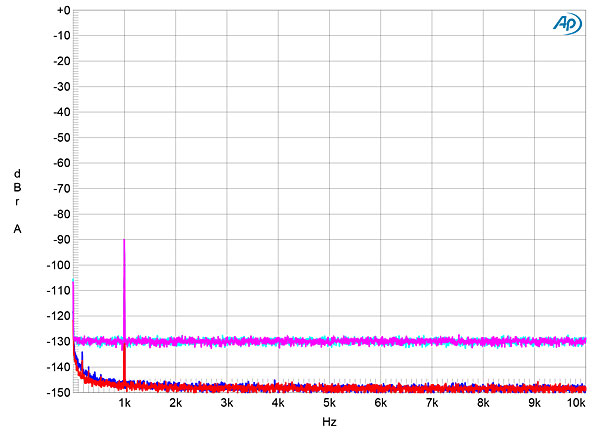
The balanced frequency response with the volume control set to "80" is shown in fig.1. It was down by just 0.125dB at 100kHz, and didn't change at lower volume-control settings or with an unbalanced signal. Channel separation (not shown) was superb, at >120dB in both directions below 7kHz, and, as can be seen in fig.2, any power-supply–related spuriae are vanishingly low in level. The wideband, unweighted signal/noise ratio, ref. 1V and taken with the input shorted to ground but the volume control set to its maximum, was 77dB; this increased to 88.4dB when the measurement bandwidth was restricted to the audioband, and even further, to 91.3dB, when A-weighted.
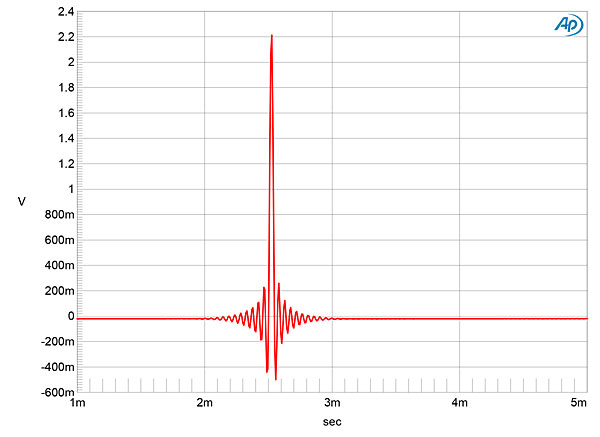
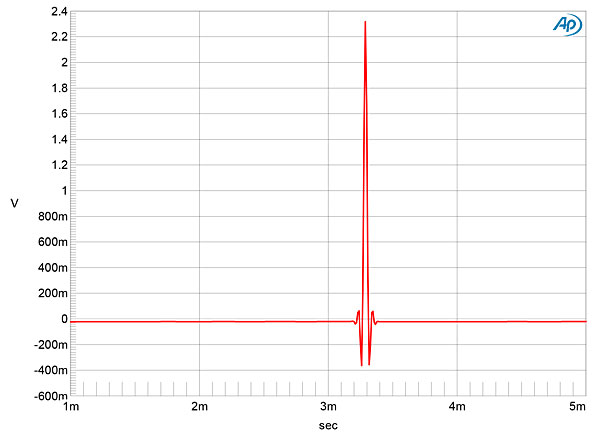
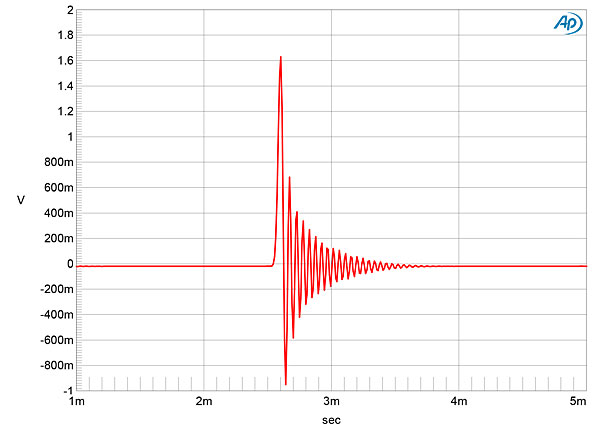
 The No.526 offers three digital reconstruction filters: Fast, Slow, and MPHAS. The impulse responses of these filters with 44.1kHz data are shown in figs. 10–12. The Fast filter (fig.10) is a conventional linear-phase FIR type; the Slow filter (fig.11) has minimal time-symmetrical ringing; and the MPHAS has, as expected, a minimum-phase impulse response (fig.12), with all the ringing following the single sample at 0dBFS.
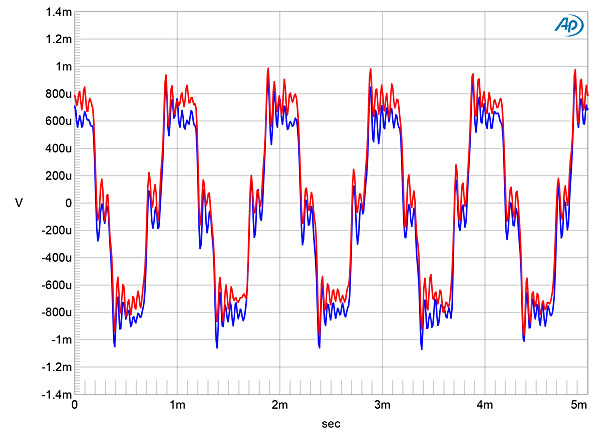
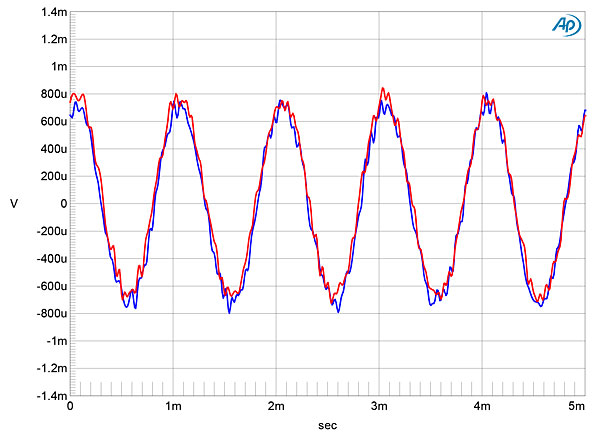
 Changing the bit depth of the incoming data from 16 to 24 with a dithered tone at –90dBFS dropped the noise floor by 18dB (fig.17), implying resolution of at least 19 bits. With an undithered tone at –90.31dBFS (fig.18), the three DC voltage levels are well defined and the level of random noise is low enough to allow the MPHAS filter's asymmetrical ringing to be seen on the leading edges of the waveform. With undithered 24-bit data at –90.31dBFS, the No.526 output a well-formed sinewave (fig.19).
 Overall, the Mark Levinson No.526 offers superb measured performance.—John Atkinson
Fig.1 Mark Levinson No.526, frequency response with volume control set to maximum gain at 1V, into: 100k ohms (left channel blue, right red), 600 ohms (left cyan, right magenta) (0.5dB/vertical div.).
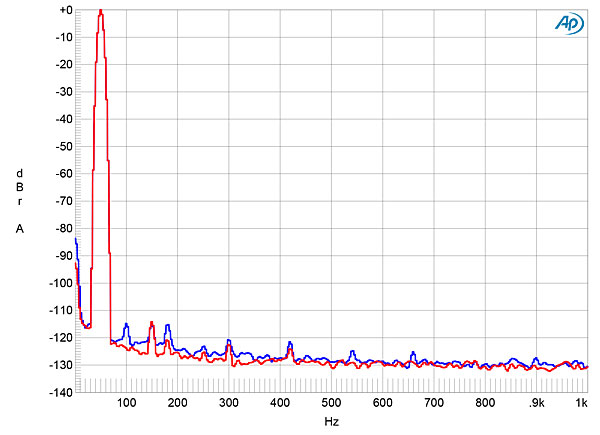
Fig.2 Mark Levinson No.526, spectrum of 1kHz sinewave, DC–1kHz, at 2V into 100k ohms (left channel blue, right red; linear frequency scale).
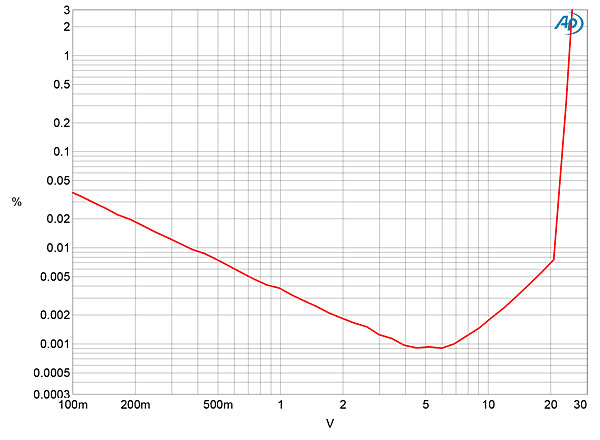
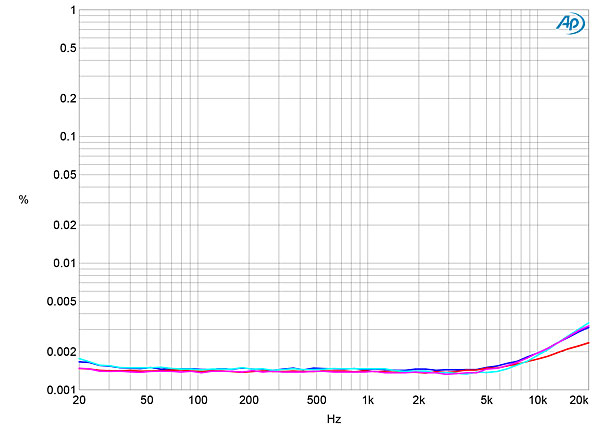
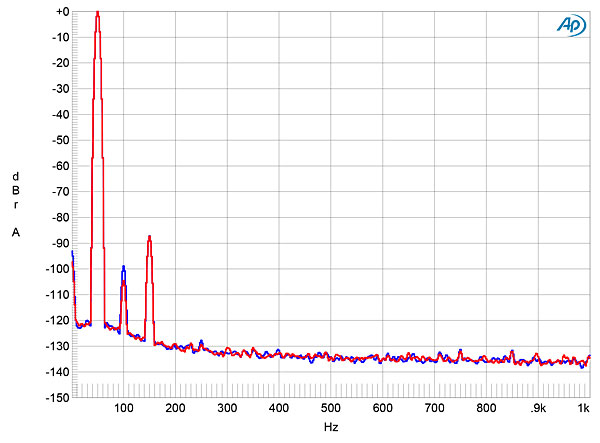
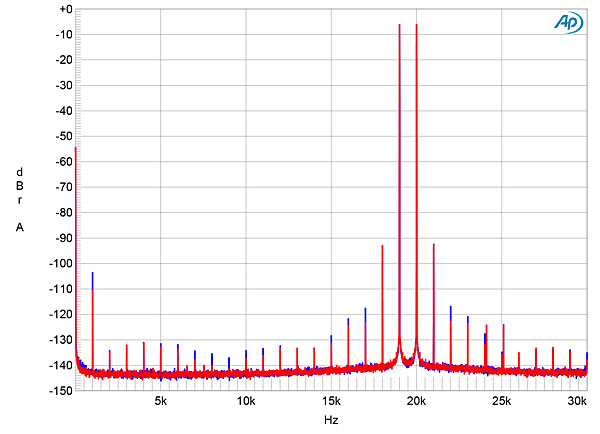
Even with the low noise floor, any distortion was even lower, as is revealed in fig.3 by the downward slope of the trace below 5V output. This graph was taken from the balanced output driving 100k ohms—the Levinson preamp clipped at 24V (!), but still managed to output 19V into 600 ohms at the clip point. The percentage of total harmonic distortion plus noise, measured at 5V, remained low, at around 0.001% across most of the audioband, even into 600 ohms, but rose slightly in the top octave, reaching 0.003% (fig.4). Fig.5 reveals that what distortion there was comprised equal amounts of second and third harmonics in the left channel (blue trace), and just the third harmonic in the right (red). But at –114dB (0.0002%) into 600 ohms, the No.526 was pretty much as linear as it is possible for a preamplifier to be. Intermodulation distortion (fig.6) was also vanishingly low in level.
Fig.3 Mark Levinson No.526, balanced distortion (%) vs 1kHz output voltage into 100k ohms.
Fig.4 Mark Levinson No.526, balanced THD+N (%) vs frequency at 5V into 100k ohms.
Fig.5 Mark Levinson No.526, balanced spectrum of 50Hz sinewave, DC–1kHz, at 2V into 600 ohms (left channel red; linear frequency scale).
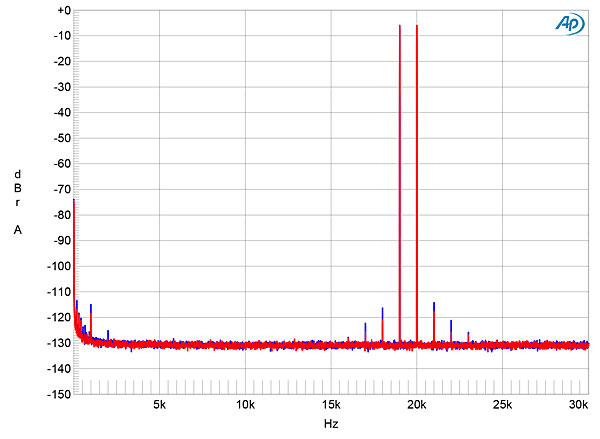
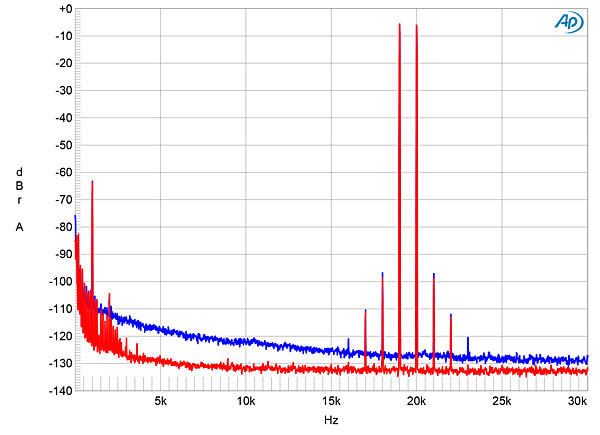
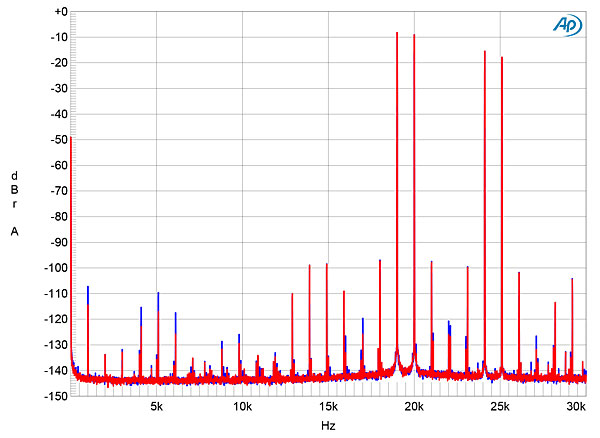
Fig.6 Mark Levinson No.526, HF intermodulation spectrum, DC–30kHz, 19+20kHz at 2V into 100k ohms (left channel blue, right red; linear frequency scale).
Turning to the No.526's phono input, I measured its behavior at the output of the balanced outputs with the preamplifier's volume control set to "80." The phono input preserved absolute polarity, and offered gains of 53.6dB (MM), 63.3dB (MC Low gain), 73.6dB (MC Medium), and 83.2dB (MC High). With the input impedance set to 47k ohms, the MM and MC input impedances both measured 44k ohms at 20Hz and 1kHz, dropping slightly to 38k ohms at 20kHz. The lower MC input-impedance settings were accurate; for example, the "100 ohms" setting measured 102 ohms.
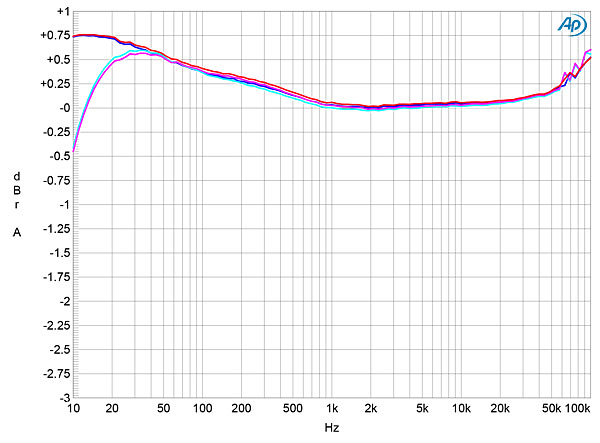
The RIAA error (fig.7, blue and red traces) showed a rise in the lower frequencies and above the audioband that reached +0.75dB at 10Hz and +0.5dB at 100kHz. With the infrasonic filter switched into circuit (cyan, magenta traces), the output began to roll off below 30Hz, but was down by just 0.4dB at 10Hz. Note the excellent channel matching in this graph. The phono input was very quiet, the audioband S/N ratios measuring 90.1dB for the MM setting, and still 78.8dB when set to MC High. A-weighting increased these ratios to 94.6 and 84dB, respectively. (For these measurements, I floated the Audio Precision's outputs with respect to ground and used a separate ground connection.) However, the phono input's channel separation was very disappointing, at just 40dB at 2kHz.
Fig.7 Mark Levinson No.526, phono input, response with RIAA correction and without (left channel blue, right red), and with infrasonic filter (left cyan, right magenta) (0.5dB/vertical div.).
The MM overload margin was excellent, at 18dB at 20Hz, 20dB at 1kHz, and still 16dB at 20kHz (all ratios ref. 1kHz at 5mV). The MC margin varied with the gain setting, but in the worst case, High gain, was still 8.7dB at 20Hz, and 10.5dB at 1kHz and 20kHz (ratios ref. 1kHz at 0.5mV). The phono input's distortion was primarily the second harmonic (fig.8), though this was at a low –80dB (0.01%), even at an input level of +12dB ref. 5mV. Intermodulation distortion (fig.9) was good, with the difference product at 1kHz, resulting from an equal mix of 19 and 20kHz tones at an input level of 100mV, lying at –64dB (0.06%).
Fig.8 Mark Levinson No.526, MM phono input, spectrum of 1kHz sinewave, DC–10kHz, at 9.6V into 100k ohms (10mV input; linear frequency scale).
Fig.9 Mark Levinson No.526, MM phono input, HF intermodulation spectrum, DC–30kHz, 19+20kHz at 3.8V peak into 100k ohms (linear frequency scale).
I tested the No.526's digital inputs with the Audio Precision's optical and electrical digital outputs and USB data sourced from my MacBook Pro running on battery power with Pure Music 3.0 playing WAV and AIFF test-tone files. Apple's USB Prober utility identified the No.526 as "USB2.0 High-Speed True HD Audio" from "HARMAN," and confirmed that its USB port operated in the optimal isochronous asynchronous mode. Apple's AudioMIDI utility revealed that, via USB, the No.526 accepted 16-, 24-, and 32-bit integer data sampled at all rates from 44.1 to 192kHz. The optical and electrical S/PDIF inputs locked to datastreams with sample rates of up to 192kHz.
With the No.526's volume control set to "80," data representing a full-scale 1kHz tone resulted in a level of 16.77V at the preamp's balanced outputs! Though this is very high, it is below the No.526's clip point, suggesting that the gain architecture is well managed. The digital inputs preserved absolute polarity.
Fig.10 Mark Levinson No.526, digital input, Fast filter, impulse response (one sample at 0dBFS, 44.1kHz sampling, 4ms time window).
Fig.11 Mark Levinson No.526, digital input, Slow filter, impulse response (one sample at 0dBFS, 44.1kHz sampling, 4ms time window).
Fig.12 Mark Levinson No.526, digital input, MPHAS filter, impulse response (one sample at 0dBFS, 44.1kHz sampling, 4ms time window).
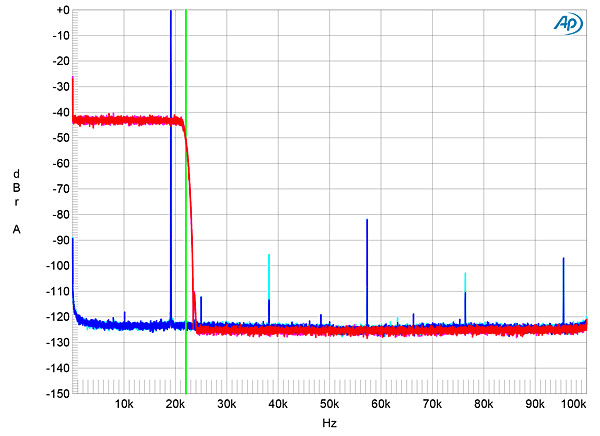
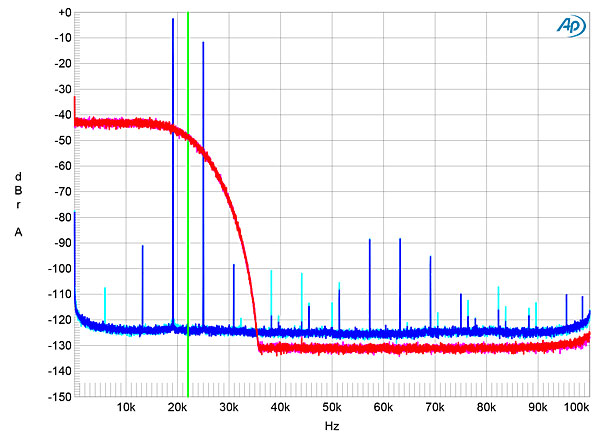
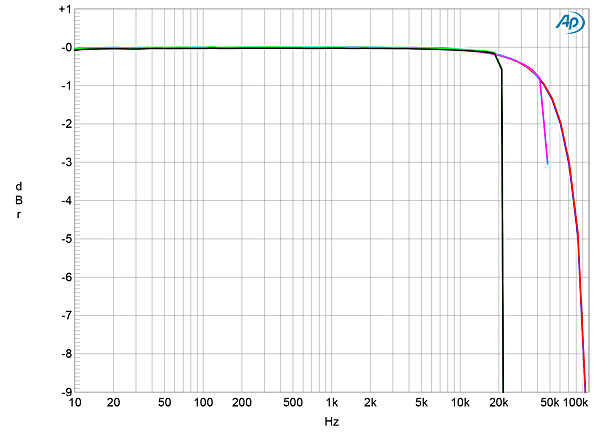
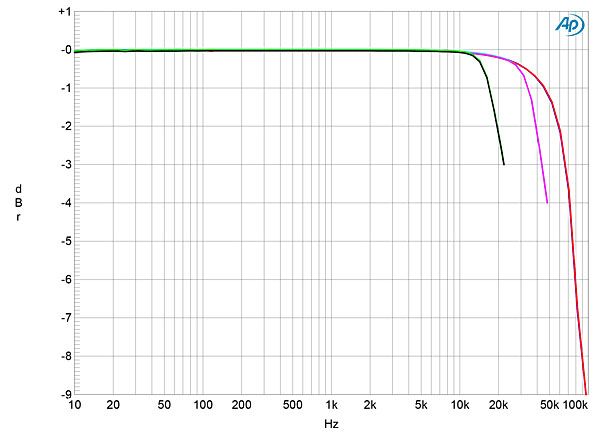
The Fast and MPHAS filters behave identically in the frequency domain (fig.13), with a steep rolloff above the audioband (magenta, red traces), and almost complete suppression of the aliased product at 25kHz of a full-scale 19.1kHz tone (cyan, blue traces). The Slow filter, as its name suggests, has a much slower ultrasonic rolloff (fig.14, magenta, red traces), with the 25kHz image suppressed by just 12dB and the appearance of higher-order aliased products (cyan, blue traces). The frequency responses of the Fast and MPHAS filters at sample rates of 44.1, 96, and 192kHz are shown in fig.15; those of the Slow filter at the same rates are shown in fig.16. No surprises anywhere here.
Fig.13 Mark Levinson No.526, digital input, MPHAS filter, wideband spectrum of white noise at –4dBFS (left channel red, right magenta) and 19.1kHz tone at 0dBFS (left blue, right cyan), with data sampled at 44.1kHz (20dB/vertical div.).
Fig.14 Mark Levinson No.526, digital input, Slow filter, wideband spectrum of white noise at –4dBFS (left channel red, right magenta) and 19.1kHz tone at 0dBFS (left blue, right cyan), with data sampled at 44.1kHz (20dB/vertical div.).
Fig.15 Mark Levinson No.526, digital input, MPHAS filter, frequency response at –12dBFS into 100k ohms with data sampled at: 44.1kHz (left channel green, right gray), 96kHz (left cyan, right magenta), 192kHz (left blue, right red) (1dB/vertical div.).
Fig.16 Mark Levinson No.526, digital input, Slow filter, frequency response at –12dBFS into 100k ohms with data sampled at: 44.1kHz (left channel green, right gray), 96kHz (left cyan, right magenta), 192kHz (left blue, right red) (1dB/vertical div.).
Fig.17 Mark Levinson No.526, digital input, spectrum with noise and spuriae of dithered 1kHz tone at –90dBFS with: 16-bit data (left channel cyan, right magenta), 24-bit data (left blue, right red) (20dB/vertical div.).
Fig.18 Mark Levinson No.526, digital input, waveform of undithered 1kHz sinewave at –90.31dBFS, 16-bit data (left channel blue, right red).
Fig.19 Mark Levinson No.526, digital input, waveform of undithered 1kHz sinewave at –90.31dBFS, 24-bit data (left channel blue, right red).
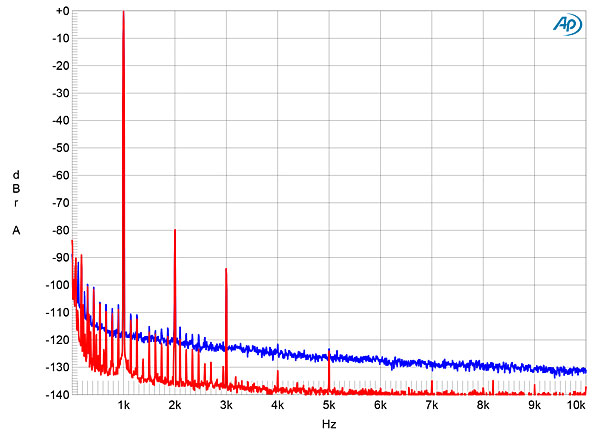
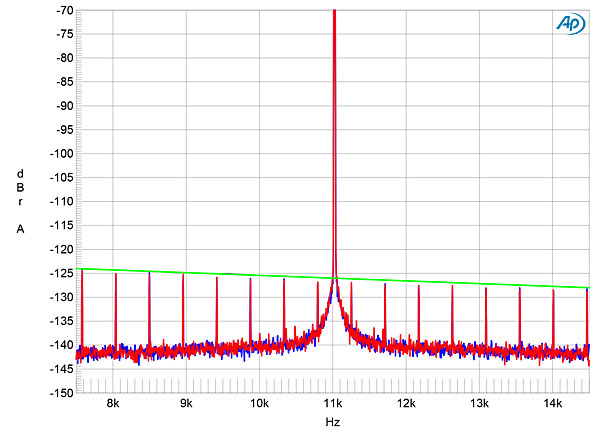
Harmonic distortion was low with digital data, the third harmonic with full-scale data lying at –90dB (0.003%, fig.20). Intermodulation distortion was also low, though the Slow filter allowed a slew of aliased images to be seen with an equal mix of 19 and 20kHz tones (fig.21), compared with the much cleaner-looking Fast and MPHAS filters (fig.22). Finally, the No.526 offered excellent rejection of word-clock jitter via its digital inputs, though there was some spectral spreading of the peak that represents a high-level tone at one-quarter the sample rate (fig.23).
Fig.20 Mark Levinson No.526, digital input, spectrum of 50Hz sinewave, DC–10kHz, at 0dBFS into 100k ohms (left channel red; linear frequency scale).
Fig.21 Mark Levinson No.526, digital input, Slow filter, HF intermodulation spectrum, DC–30kHz, 19+20kHz at 0dBFS into 100k ohms, 44.1kHz data (left channel blue, right red; linear frequency scale).
Fig.22 Mark Levinson No.526, digital input, Fast filter, HF intermodulation spectrum, DC–30kHz, 19+20kHz at 0dBFS into 100k ohms, 44.1kHz data (left channel blue, right red; linear frequency scale).
Fig.23 Mark Levinson No.526, digital input, high-resolution jitter spectrum of analog output signal, 11.025kHz at –6dBFS, sampled at 44.1kHz with LSB toggled at 229Hz: 16-bit AES/EBU data (left channel blue, right red). Center frequency of trace, 11.025kHz; frequency range, ±3.5kHz.


