Sidebar 3: Measurements
I measured the Gold Note DS-10 with my Audio Precision SYS2722 system (see the January 2008 "As We See It"). I powered the DS-10 from the PSU-10 EVO supply, which, following the instructions in the latter's manual, I placed to the D/A processor's left, separated by a few inches. I performed a complete set of measurements from the balanced outputs, repeating some tests from the unbalanced and headphone outputs. As well as using the Audio Precision as a source of data, I used Roon and mconnect Control to send data to the DS-10 over my network via Ethernet.
I also used a USB connection to send data to the Gold Note from my battery-powered MacBook Pro running Adobe Audition and Pure Music.
The DS-10's coaxial S/PDIF input and the AES/EBU input locked to datastreams with sample rates up to 192kHz. The optical inputs were restricted to sample rates of 96kHz and below. Apple's USB Prober utility identified the processor as "GOLD NOTE USB-DAC" from "Akamai," with the serial number "413-001." The Gold Note's USB port operated in the optimal isochronous asynchronous mode. Apple's AudioMIDI utility revealed that, via USB, the DS-10 accepted 32-bit integer data sampled at all rates from 32 to 384kHz.
The DS-10's maximum output level in DAC mode was 2.7V, balanced, and 1.35V, unbalanced, both into 100k ohms. (According to Roon, in DAC mode, the DS-10's volume control is set to "91.") Switching to Pre mode, with the volume control set to "91"—although the volume control's maximum setting is "100," the DS-10 clipped with full-scale digital signals at settings greater than "91"—the output levels were 4.525V, balanced, and 2.25V, unbalanced. The maximum headphone output level was 8.02V, this with a volume control setting of "87" in low-gain mode and "80" in high-gain mode. Again, the headphone output clipped at higher settings of the volume control.
All three sets of outputs preserved absolute polarity with all inputs. The output impedance is specified as a low 50 ohms for both balanced and unbalanced outputs. I measured higher values, though these are still low in absolute terms: the unbalanced output impedance was 87 ohms at 1kHz, increasing to 203 ohms at 20Hz and 100 ohms at 20kHz. The balanced output impedances were twice the unbalanced values, as usual. The headphone output impedance was a fairly low 10 ohms at all audioband frequencies.
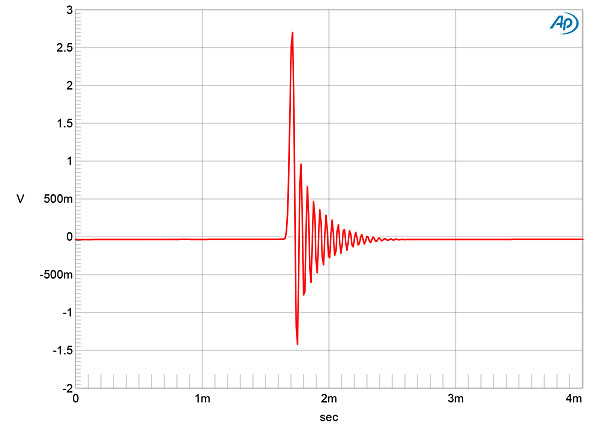
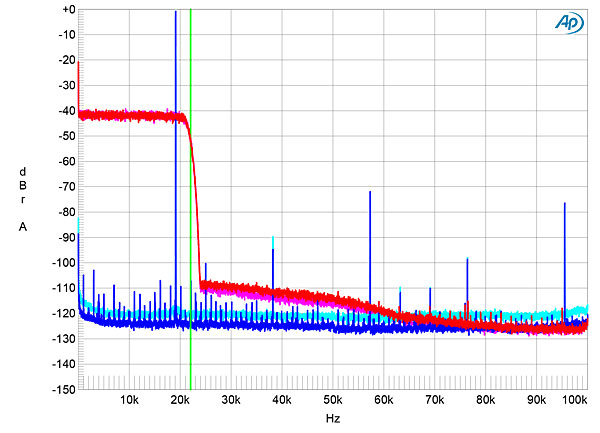
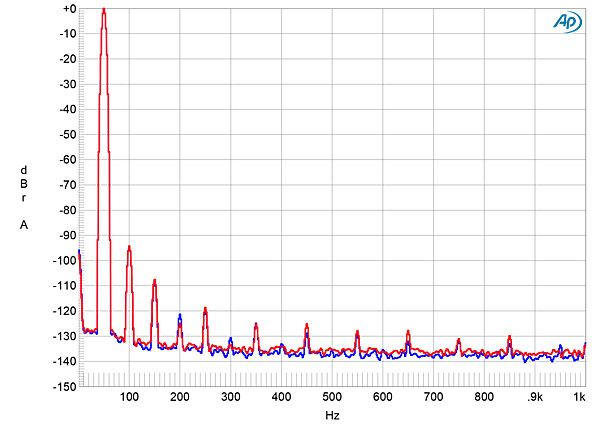
Although I looked at the effect of the three Equalization presets on the DS-10's behavior, I left them bypassed for the measurements. The DS-10's reconstruction filter had a minimum-phase impulse response with 44.1kHz data (fig.1), with all the ringing following the single high sample at 0dBFS. With 44.1kHz-sampled white noise, the Gold Note's response featured a fast rolloff above the audioband, but with a slower rolloff above 24kHz (fig.2, red and magenta traces). The aliased image at 25kHz of a full-scale 19.1kHz tone (blue and cyan traces) was suppressed by just over 100dB and while distortion harmonics can be seen, the highest in level was the third at –72dB (0.025%).
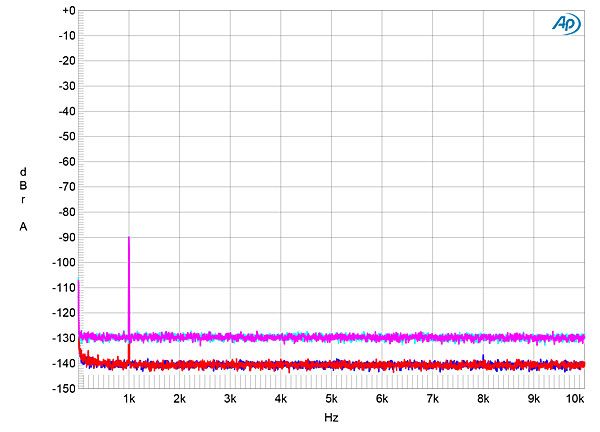
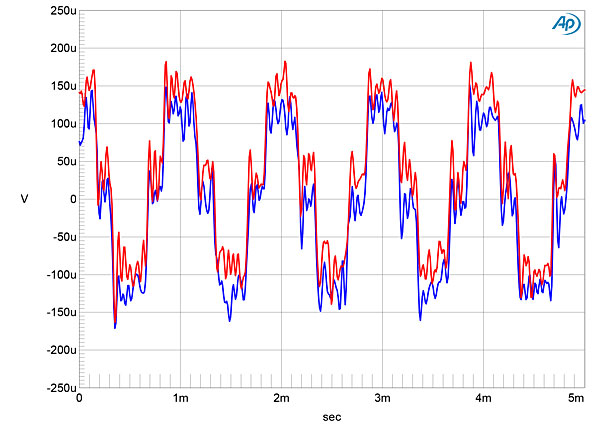
 The Gold Note's channel separation was excellent in the midrange, at >100dB in both directions but reduced at the top of the audioband to 71dB, left-to-right, and 75dB, right-to-left. The low-frequency noise floor was commendably free from power supply–related spuriae. When I increased the bit depth from 16 to 24 with a dithered 1kHz tone at –90dBFS (fig.4), the random noise floor dropped by 12dB, meaning that the DS-10 offers 18 bits' worth of resolution. With undithered 16-bit data representing a tone at exactly –90.31dBFS, the three DC voltage levels described by the data were well-resolved (fig.5), though the waveform was overlaid with high-frequency noise.
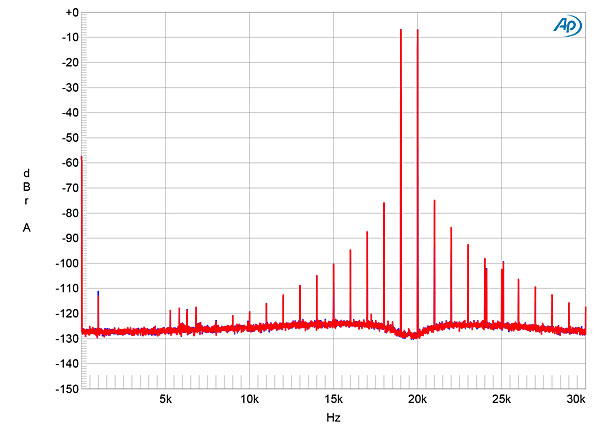
 The Gold Note DS-10 offered low levels of harmonic distortion. With a full-scale 50Hz tone into 100k ohms (fig.6), the second harmonic was the highest in level, but at –96dB (0.0015%) is inconsequential. The level and harmonic signature of the distortion didn't rise when I reduced the load to the punishing 600 ohms, which suggests that the DS-10 has an excellent output stage. The cyan and blue traces in fig.2 indicated that the DS-10's distortion is higher at the top of the audioband than it is lower in frequency, so I wasn't surprised to find high-order intermodulation products present with equal-level tones at 19 and 20kHz with the combined waveform peaking at 0dBFS (fig.7). However, these products all lie below –76dB (0.015%), and the second-order difference product was at a very low –110dB (0.0003%). As with the DS-10's harmonic distortion, the levels of the intermodulation products didn't rise with the 600 ohm load impedance.
 I got an odd result when I tested the Gold Note processor for its rejection of word-clock jitter with 16-bit AES/ EBU and S/PDIF J-Test data. Other than the pair closest to the spectral spike that represents the high-level tone at one-quarter the sample rate, the odd-order harmonics of the LSB-level, low-frequency squarewave were obscured by the analog noise floor (fig.8). Repeating the spectral analysis with 16-bit optical data gave the same result, and when I used 24-bit J-Test data, the single pair of sidebands persisted (fig.9). Things looked more normal with 16-bit J-Test data sourced from USB or Ethernet, and almost all of the odd-order harmonics of the LSB-level, low-frequency squarewave were now at the correct levels (fig.10, sloping green line). However, with 24-bit USB or Ethernet data, the single pair of sidebands didn't disappear as they should have done, and a trio of low-level random tones can be seen between 9kHz and 10kHz, these of unknown origin.
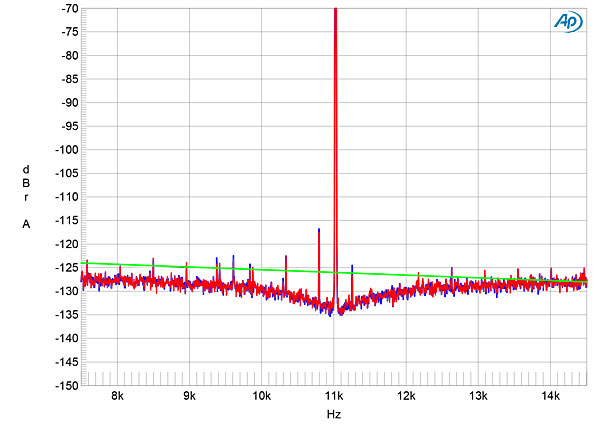
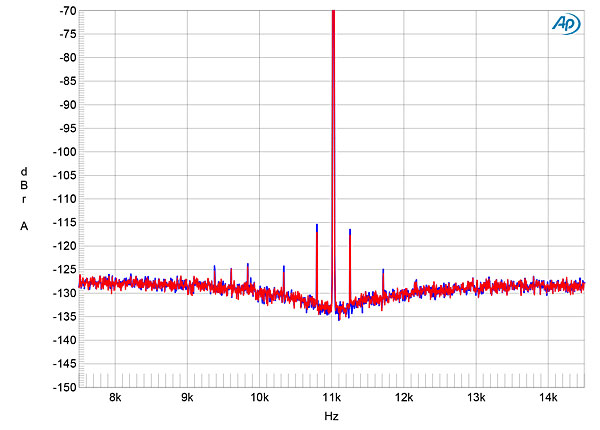
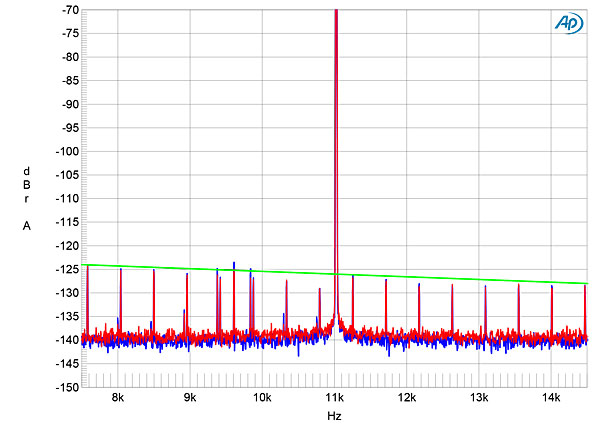
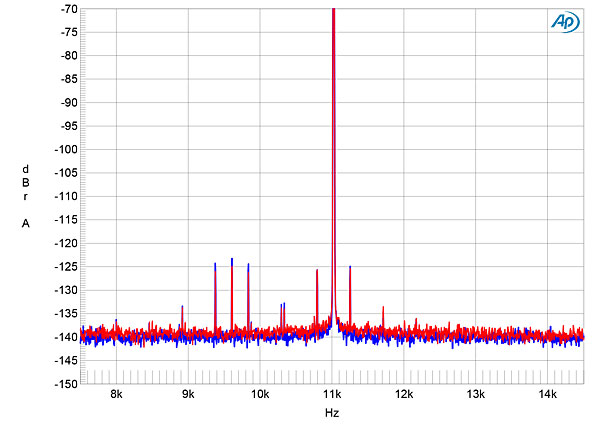
Fig.1 Gold Note DS-10, impulse response (one sample at 0dBFS, 44.1kHz sampling, 4ms time window).
Fig.2 Gold Note DS-10, wideband spectrum of white noise at –4dBFS (left channel red, right magenta) and 19.1kHz tone at 0dBFS (left blue, right cyan) into 100k ohms with data sampled at 44.1kHz (20dB/vertical div.).
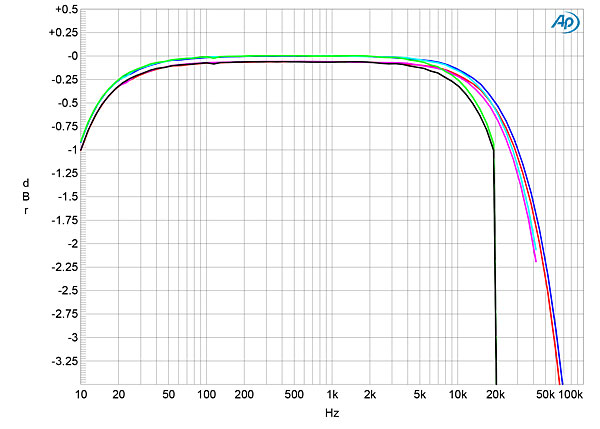
With data sampled at 44.1kHz, the DS-10's frequency response rolled off gently in the top audio octave (fig.3, green and gray traces), reaching –1dB at 20kHz before the inevitable sharp rolloff above that frequency. At higher sample rates (fig.3, cyan, magenta, blue, and red traces), the responses were down by 0.5dB at 20kHz, with gentle ultrasonic rolloffs.
Fig.3 Gold Note DS-10, frequency response at –12dBFS into 100k ohms with data sampled at: 44.1kHz (left channel green, right gray), 96kHz (left channel cyan, right magenta), 192kHz (left blue, right red) (0.5dB/vertical div.).
Fig.4 Gold Note DS-10, spectrum with noise and spuriae of dithered 1kHz tone at –90dBFS with: 16-bit data (left channel cyan, right magenta), 24-bit data (left blue, right red) (20dB/vertical div.).
Fig.5 Gold Note DS-10, waveform of undithered 16-bit, 1kHz sinewave at –90.31dBFS (left channel blue, right red).
Fig.6 Gold Note DS-10, spectrum of 50Hz sinewave, DC–1kHz, at 0dBFS into 100k ohms (left channel blue, right red; linear frequency scale).
Fig.7 Gold Note DS-10, HF intermodulation spectrum, DC–30kHz, 19+20kHz at 0dBFS into 100k ohms, 44.1kHz data (left channel blue, right red; linear frequency scale).
Fig.8 Gold Note DS-10, high-resolution jitter spectrum of analog output signal, 11.025kHz at –6dBFS, sampled at 44.1kHz with LSB toggled at 229Hz: 16-bit AES/EBU data (left channel blue, right red). Center frequency of trace, 11.025kHz; frequency range, ±3.5kHz.
Fig.9 Gold Note DS-10, high-resolution jitter spectrum of analog output signal, 11.025kHz at –6dBFS, sampled at 44.1kHz with LSB toggled at 229Hz: 24-bit AES/EBU data (left channel blue, right red). Center frequency of trace, 11.025kHz; frequency range, ±3.5kHz.
Fig.10 Gold Note DS-10, high-resolution jitter spectrum of analog output signal, 11.025kHz at –6dBFS, sampled at 44.1kHz with LSB toggled at 229Hz: 16-bit USB data (left channel blue, right red). Center frequency of trace, 11.025kHz; frequency range, ±3.5kHz.
Fig.11 Gold Note DS-10, high-resolution jitter spectrum of analog output signal, 11.025kHz at –6dBFS, sampled at 44.1kHz with LSB toggled at 229Hz: 24-bit USB data (left channel blue, right red). Center frequency of trace, 11.025kHz; frequency range, ±3.5kHz.
There are good aspects to the Gold Note DS-10's behavior on the test bench—the bombproof output stage and the low levels of harmonic distortion—and others that left me puzzled, like the odd behavior with J-Test data sourced by AES/EBU or S/PDIF.—John Atkinson


