Sidebar 3: Measurements
For logistical reasons, I measured a different sample of the Dan D'Agostino Master Audio Systems Progression M550 monoblock (serial number PM006P) with my Audio Precision SYS2722 system (see the January 2008 "As We See It"). I repeated some of the measurements with the magazine's Audio Precision APx500 analyzer. Usefully, the box included a set of tests performed with the APx500.
Before I performed the testing, I preconditioned the amplifier by running it at one-eighth its specified power into 8 ohms for 30 minutes, as recommended by the Consumer Electronics Association. After the preconditioning, the M550's top panel was surprisingly cool, at 96.8°F (36°C). The temperature of the massive heatsinks on the amplifier's sides was 101.8°F (38.8°C) and didn't increase significantly with the amplifier idling.
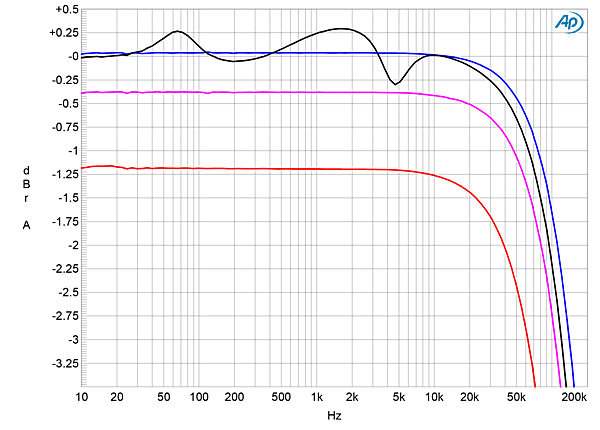
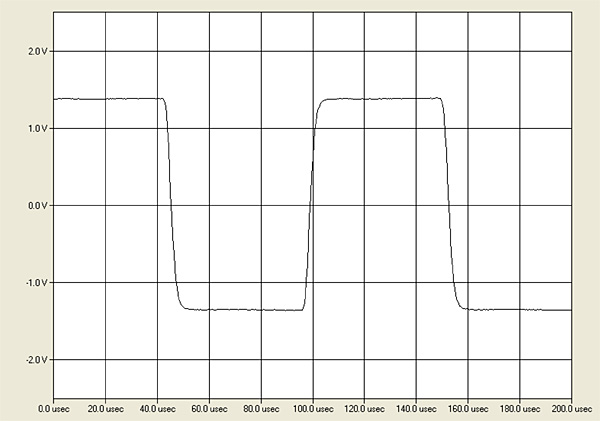
The voltage gain into 8 ohms for the balanced input was 29.7dB, and the input inverted absolute polarity, the opposite of what I had found with earlier D'Agostino amplifiers (footnote 1). The input impedance at low and middle frequencies was very slightly lower than the specified 100k ohms, at 95k ohms, dropping inconsequentially to 50k ohms at 20kHz. The output impedance was higher than the specified 0.1 ohm, at 0.37 ohm at 20Hz and 1kHz, rising slightly to 0.4 ohm at 20kHz. The response with our standard simulated loudspeaker therefore varied by ±0.26dB (fig.1, gray trace). The amplifier offered a wide small-signal bandwidth, the output into 8 ohms (blue trace) not reaching –3dB until 140kHz. The Progression M550's reproduction of a 10kHz squarewave (fig.2) accordingly featured very short risetimes with, commendably, no apparent overshoot or ringing. (This is something that has been a consistent feature with amplifiers designed by Dan D'Agostino.)
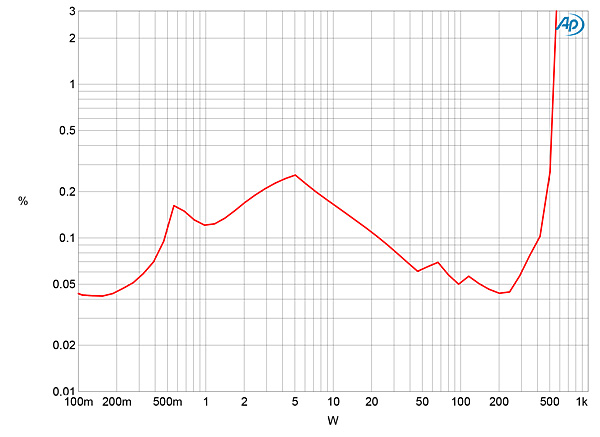
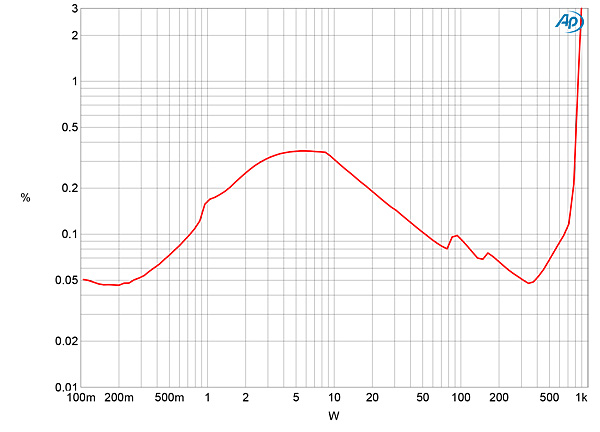
 When I examined how the percentage of THD+N varied with output power, with clipping defined as when the THD+noise in the amplifier's output reached 1%, the M550 clipped at 555W into 8 ohms (27.44dB, fig.4), which is marginally higher than the specified 550W (27.4dBW). The clipping power into 4 ohms (fig.5) was 840W (26.23dBW); though this is 1.17dB lower than the specified 1.1kW, I don't hold the wall voltage constant during these tests, feeling that this is more representative of an amplifier's behavior in a typical system. The wall voltage was 118.7V with the amplifier idling but had dropped to 115.1V with the amplifier clipping into 4 ohms. Note from these two graphs that the distortion percentage at low powers is higher than it is at high powers. This behavior was consistent with both Audio Precision analyzers and is almost identical to what I found with the Dan D'Agostino Progression Mono amplifier that JVS reviewed in October 2017.
Footnote 1: In measuring the Momentum HD preamplifier, I found it inverted polarity, but in a Manufacturers' Comment, Dan D'Agostino wrote that this was due to an error in the pre-production firmware code that was fixed in all production units.
Fig.1 Dan D'Agostino Progression M550, frequency response at 2.83V into: simulated loudspeaker load (gray), 8 ohms (blue), 4 ohms (magenta), 2 ohms (red) (0.5dB/vertical div.).
Fig.2 Dan D'Agostino Progression M550, small-signal, 10kHz squarewave into 8 ohms.
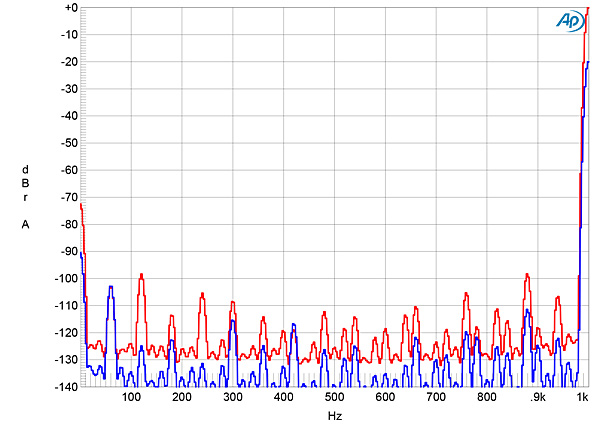
Measured with both phases of the balanced input shorted to ground, the M550's wideband, unweighted signal/noise ratio was 55.3dB, ref. 1W into 8 ohms. This ratio improved to 80.5dB when the measurement bandwidth was restricted to 22Hz–22kHz, and to 89dB when the reading was A-weighted. The blue trace in fig.3, taken at 1W into 8 ohms, reveals that the primary source of noise is magnetic interference at 60Hz and its odd-order harmonics, which I assume stem from the massive toroidal transformer. However, at high powers (red trace), the spuriae at 120Hz and its harmonics increase in level.
Fig.3 Dan D'Agostino Progression M550, spectrum of 1kHz sinewave, DC–1kHz, at 1W (blue) and at 100W (red) into 8 ohms (linear frequency scale).
Fig.4 Dan D'Agostino Progression M550, distortion (%) vs 1kHz continuous output power into 8 ohms.
Fig.5 Dan D'Agostino Progression M550, distortion (%) vs 1kHz continuous output power into 4 ohms.
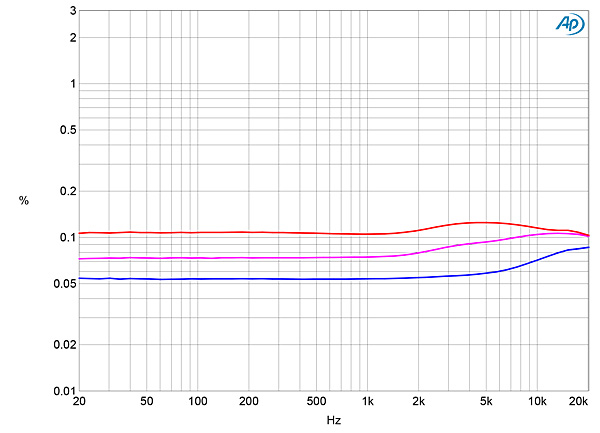
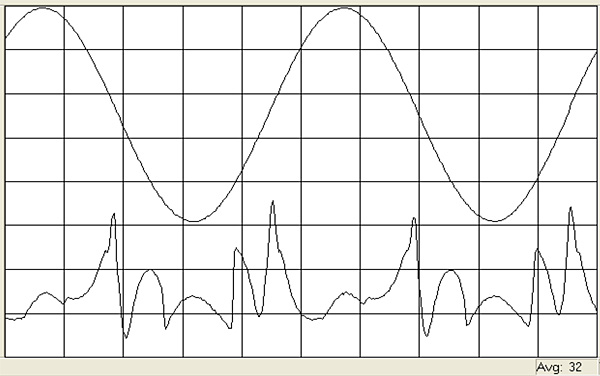
As with the earlier amplifier, I examined how the THD+N percentage varied with frequency at a high level, 28.3V, which is equivalent to 100W into 8 ohms, 200W into 4 ohms, and 400W into 2 ohms. (The front-panel meter's needle lay just above "500" at this level.) The results are shown in fig.6: The distortion and noise remain low over most of the audioband into the higher impedances with only a minuscule rise in the top octave. (This graph confirms the test results sent by the manufacturer.) However, when I examined the waveform of the THD+N at 100W into 8 ohms after notching out the fundamental (fig.7), I saw spikes in the residual waveform (bottom trace) that coincided with the zero-crossing points in the signal's waveform (top trace). This behavior indicates the presence of crossover distortion.
Fig.6 Dan D'Agostino Progression, THD+N (%) vs frequency at 28.3V into: 8 ohms (blue), 4 ohms (magenta), 2 ohms (red).
Fig.7 Dan D'Agostino Progression M550, 1kHz waveform at 100W into 8 ohms, 0.062% THD+N (top); distortion and noise waveform with fundamental notched out (bottom, not to scale).
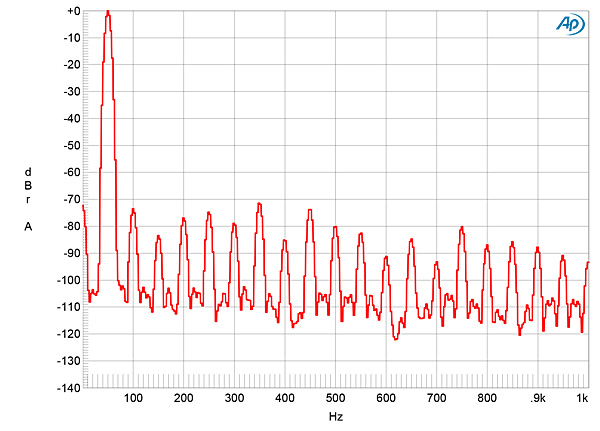
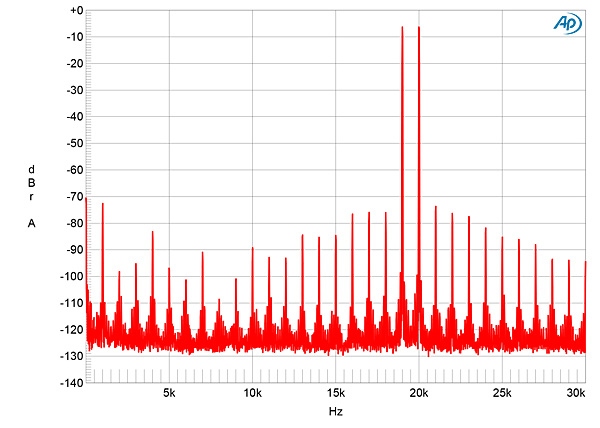
Fig.8 shows the spectrum of the amplifier's output while it drove 50Hz at 100W into 8 ohms. The subjectively innocuous second harmonic lies at –74dB (0.015%), but a regular series of high-order harmonics can be seen, which correlates with the waveform of the spuriae shown in fig.7. The harmonic spectrum was very similar with the amplifier driving 50Hz into 4 ohms and 1kHz into 8 ohms at 28.3V (not shown). At 1W into 8 ohms, the second harmonic was still the highest in level but lay at –60dB (0.1%, not shown) and was still accompanied by higher-order harmonics. Fig.9 shows the spectrum of the M550's output as it drove an equal mix of 19 and 20kHz tones into 8 ohms at a peak level of 100W. While the difference product at 1kHz lay at an okay –73dB (0.016%), there are also many higher-order intermodulation products visible in this graph.
Fig.8 Dan D'Agostino Progression M550, spectrum of 50Hz sinewave, DC–1kHz, at 100W into 8 ohms (linear frequency scale).
Fig.9 Dan D'Agostino Progression M550, HF intermodulation spectrum, DC–30kHz, 19+20kHz at 100W peak into 8 ohms (linear frequency scale).
The Dan D'Agostino Master Audio Systems Progression M550 is a powerful amplifier indeed and will not be fazed by being required to drive low-impedance loudspeakers. However, the presence of what appeared to be crossover distortion, which suggests insufficient output-stage bias, is puzzling.—John Atkinson
Footnote 1: In measuring the Momentum HD preamplifier, I found it inverted polarity, but in a Manufacturers' Comment, Dan D'Agostino wrote that this was due to an error in the pre-production firmware code that was fixed in all production units.


