Sidebar 3: Measurements
I measured the Dan D'Agostino Momentum HD's performance with my Audio Precision SYS2722 system (see the January 2008 "As We See It"), checking some of the measurements with a loaned sample of Audio Precision's top-of-the-line AP555x system. The gain at 1kHz for the balanced inputs to the balanced output with the volume control set to the maximum was 10.85dB for the low-gain setting, which was how JVS auditioned the preamplifier. (Unless indicated otherwise, all the measurements were taken with this gain setting.) Setting the gain to "26" resulted in a gain at 1kHz of 26.2dB.
To my surprise, as this contradicts what is described in the Momentum HD's manual, the preamplifier inverted polarity with the front-panel meter illuminated green. Pressing the Phase button on the remote control turned the meter's illumination red and resulted in correct absolute polarity. My test system is wired with pin 2 of the XLR jacks "hot," ie, carrying the positive phase of the balanced signal, which is the AES standard.
The Momentum HD's input impedance is specified as an extremely high 1M ohm. The technique I use to estimate input impedance becomes increasingly inaccurate for values greater than 100k ohms; my measurements indicated that the preamplifier's input impedance was at least 500k ohms. Although the specified output impedance is a very low 10 ohms, I measured 80 ohms. This value is still low and was consistent across the audioband.
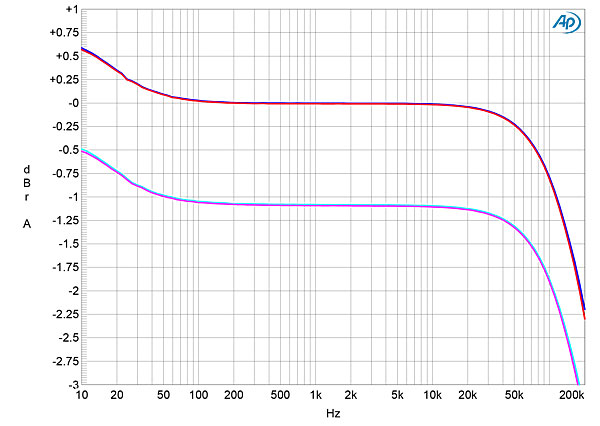
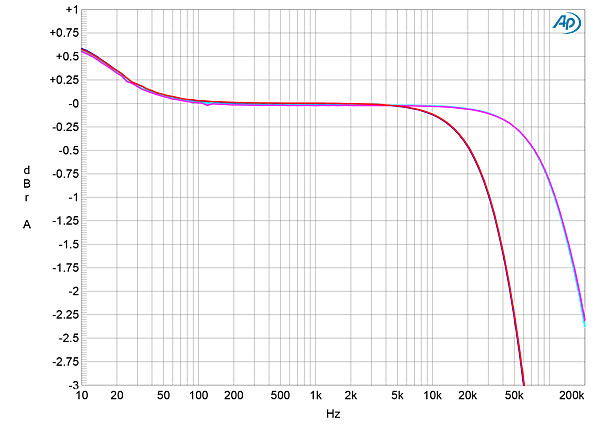
The preamplifier's volume control operated in accurate 0.5dB steps. With this control set to its maximum, the frequency response was flat from 100Hz to 20kHz both into the high 100k ohm load (fig.1, blue and red traces) and into 600 ohms (cyan, magenta). A slight boost can be seen in the low bass, reaching +0.55dB at 10Hz. Unlike the original Momentum preamplifier, which Michael Fremer reviewed in August 2014 and had a flat response to 200kHz (footnote 1), the HD's response was down by 2.25dB at 200kHz. Fig.1 also shows the superb matching between channels, which was maintained at lower settings of the control and in the two gain conditions. However, with the gain set to 26dB, the response rolled off earlier, with the output now –0.5dB at 20kHz and –3dB at 60kHz (fig.2, blue and red traces).
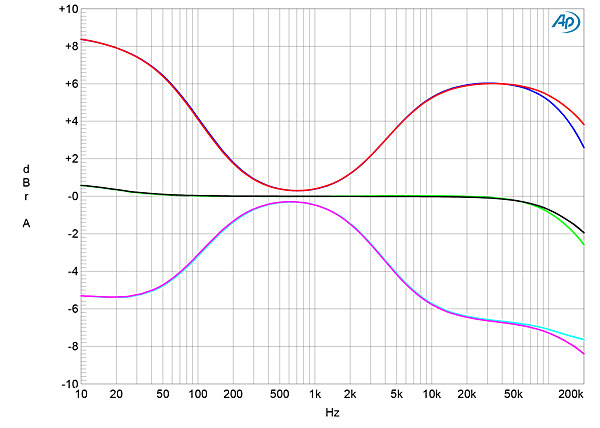
 With the gain set to 10.95dB and the tone controls active but set to "0" (fig.3, green and gray traces), the audioband response was the same as it had been in fig.1. Set to their maximum and minimum positions, the bass and treble controls offered sensible amounts of boost and cut (blue and red traces). Channel separation was superb in the L–R direction, at >110dB below 3kHz and 100dB at 20kHz (not shown). It was not as good in the R–L direction, at 80dB below 1kHz.
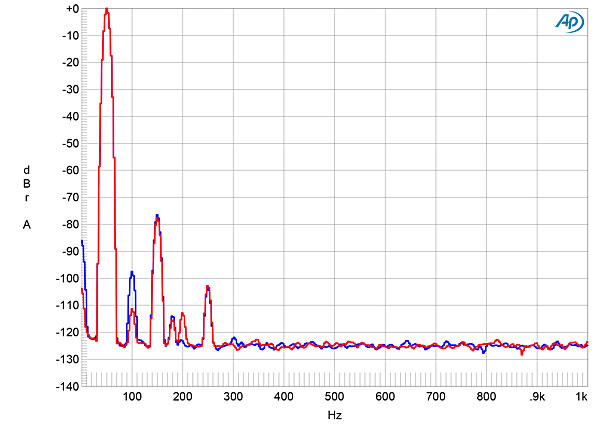
 While the second and third harmonics can be seen in the spectrum at the same output level into 100k ohms (fig.8), these are at very low levels, close to –100dB. Though the second harmonic remained at the same level when I reduced the load impedance to 600 ohms, the third harmonic rose to –78dB in both channels (fig.9). Tested for intermodulation distortion with an equal mix of 19 and 20kHz tones at peak level of 4V, the second-order difference product at 1kHz lay at or below –10dB (fig.10). The higher-order products in this graph were even lower in level.

Footnote 1: See fig.1 here.
Fig.1 Dan D'Agostino Momentum HD, frequency response with volume control set to the maximum at 1V into: 100k ohms (left channel blue, right red), 600 ohms (left cyan, right magenta) (0.5dB/vertical div.).
Fig.2 Dan D'Agostino Momentum HD, frequency response with volume control set to the maximum at 1V into 100k ohms with gain set to 26dB (left channel blue, right red) and 10.95dB (left cyan, right magenta) (0.5dB/vertical div.).
Fig.3 Dan D'Agostino Momentum HD, frequency response with bass and treble controls set to their maximum and minimum positions into 100k ohms (left channel blue, right red), and set to "0" but still in-circuit (left green, right gray) (2dB/vertical div.).
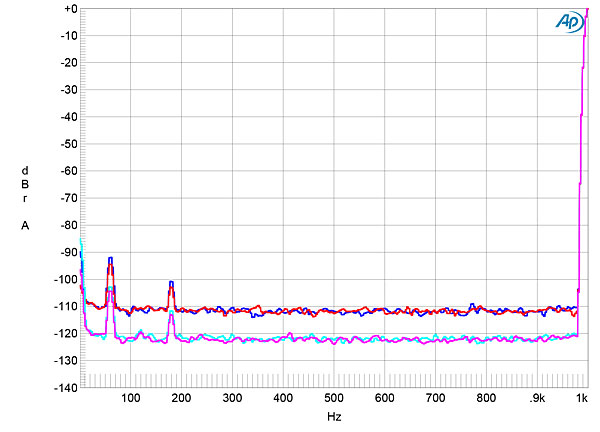
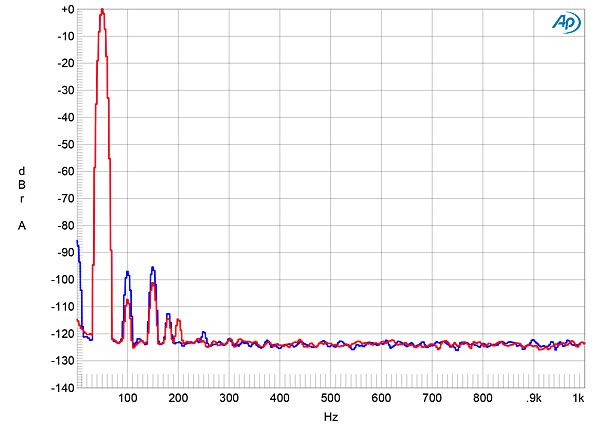
The original Momentum had low levels of noise, with an unweighted, wideband S/N ratio with the volume control set to its maximum of 75.3dB ref. 1V output, this improving to 92dB when the measurement bandwidth was restricted to the audioband. The Momentum HD wasn't as quiet, the wideband, unweighted signal/noise ratio, taken under the same conditions, measuring 60.2dB, again ref. 1V output. Restricting the measurement bandwidth to the audioband increased the HD's S/N ratio to 77dB, while switching an A-weighting filter into circuit gave a further improvement to 79.7dB. The low-frequency spectrum with the preamplifier reproducing a 1kHz signal at 1V into 100k ohms (fig.4), with the gain set to 10.95dB and the volume control set to its maximum (blue and red traces) and unity gain (cyan, magenta), indicated that the noise components occurred before the volume control. While supply-related spuriae can be seen at 60Hz and 180Hz in this graph, these are very low in level, even with the preamplifier chassis sitting on top of the power supply, which is how I performed the measurements.
Fig.4 Dan D'Agostino Momentum HD, spectrum of 1kHz sinewave, DC–1kHz, at 1V into 100k ohms with volume control set to its maximum (left channel blue, right red) and to unity gain (left cyan, right magenta) (linear frequency scale).
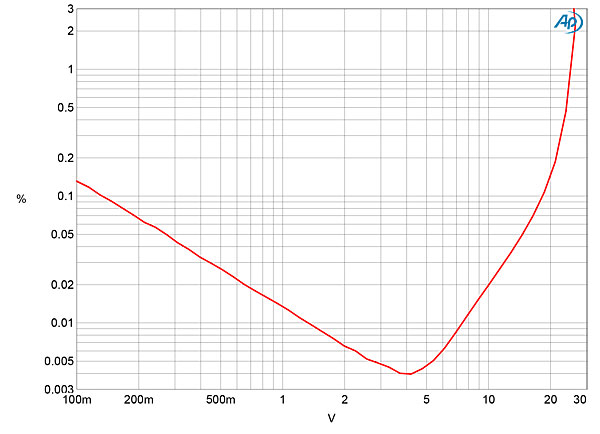
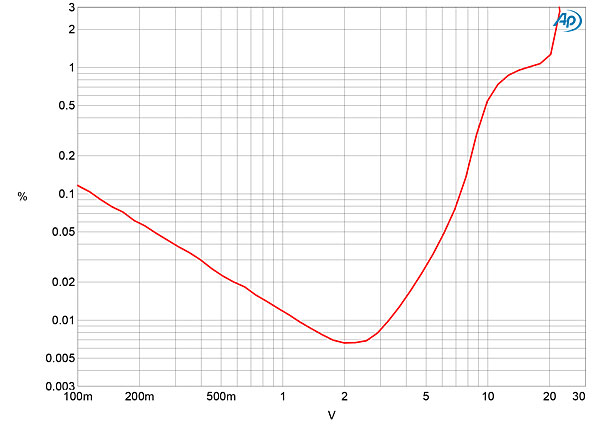
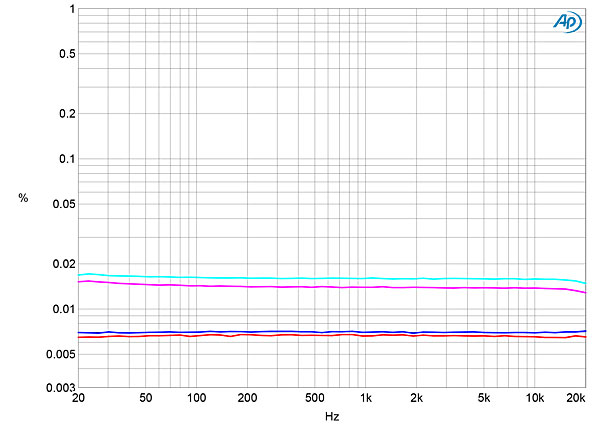
Fig.5 plots the percentage of THD+noise in the Momentum HD's output into 100k ohms. The THD+N rises below 4V output due to the fixed level of noise becoming an increasing percentage of the signal level. The preamplifier's balanced output doesn't clip (ie, when the THD+N reaches 1%) until a very high 24V. Reducing the load to a punishing 600 ohms reduced the maximum output level to 16V (fig.6), which is still much higher than will be needed to drive a power amplifier into clipping. To be sure that the reading was not dominated by noise, I measured the Momentum HD's distortion change with frequency at 4V, where figs.5 and 6 suggested that actual distortion was starting to rise above the low noise floor. The THD+N percentage was extremely low in both channels throughout the audioband into 100k ohms (fig.7, blue and red traces). Though the THD+N percentage rose into 600 ohms (cyan, magenta traces), it was still below 0.02% across the band.
Fig.5 Dan D'Agostino Momentum HD, distortion (%) vs 1kHz output voltage into 100k ohms.
Fig.6 Dan D'Agostino Momentum HD, distortion (%) vs 1kHz output voltage into 600 ohms.
Fig.7 Dan D'Agostino Momentum HD, distortion (%) vs frequency at 4V into: 100k ohms (left channel blue, right red), 600 ohms (left cyan, right magenta).
Fig.8 Dan D'Agostino Momentum HD, spectrum of 50Hz sinewave, DC–1kHz, at 4V into 100k ohms (left channel blue, right red; linear frequency scale).
Fig.9 Dan D'Agostino Momentum HD, spectrum of 50Hz sinewave, DC–1kHz, at 4V into 600 ohms (left channel blue, right red; linear frequency scale).
Fig.10 Dan D'Agostino Momentum HD, HF intermodulation spectrum, DC–30kHz, 19+20kHz at 4V into 100k ohms (left channel blue, right red; linear frequency scale).
While the Momentum HD's measurements in some areas—channel separation, S/N ratios—are not the equal of the original Momentum's, this doesn't detract from the fact that it is a well-engineered preamplifier.—John Atkinson
Footnote 1: See fig.1 here.