Sidebar 3: Measurements
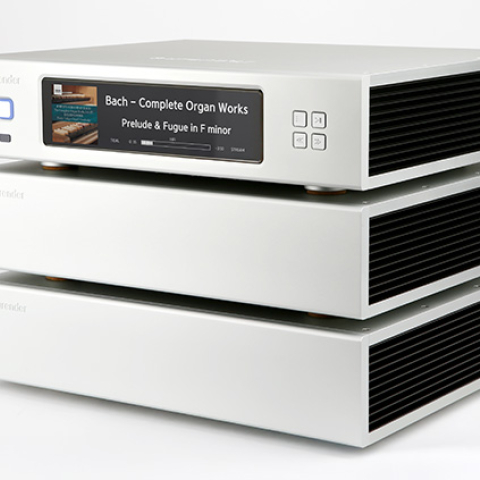
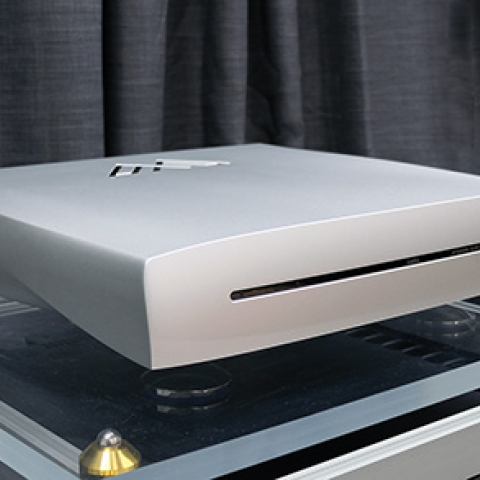
I used my sample of the top-of-the-line Audio Precision SYS2722 system (see www.ap.com and the January 2008 "As We See It") to examine the Sony HAP-Z1ES's measured behavior. Initially I tried playing the WAV files of my test signals from a FAT32-formatted USB flash drive, but the Sony didn't recognize the drive's format. (It did recognize that a drive had been inserted and asked me if I wanted it formatted.) I then hooked up the Sony to my home network via Ethernet and transferred the WAV files from my Apple MacBook Pro using Sony's HAP Music Transfer app. This worked flawlessly, and for the measurements I played the files from the Sony's internal hard drive using the front-panel controls.
While the Sony will play DSD64 and DSD128 files, I don't yet have any test signals encoded in those formats; all my measurements were therefore performed with LPCM files. The Sony played files with both 16- and 24-bit word lengths and with sample rates ranging from 44.1 to 192kHz and all stops in between. Although I'd loaded a WAV file sampled at 384kHz onto the Sony's drive, the filename was grayed out on the Sony's display and couldn't be selected for playback. I didn't test specifically for the effect of Sony's Digital Sound Enhancement Engine, but the DSD Remastering Engine was engaged for the measurements.
Except where noted, all measurements were taken from the balanced output jacks. The maximum output level at 1kHz was the same from the balanced and single-ended outputs, at 2.07V left and 2.106V right, the latter 0.15dB higher than the former. Both sets of outputs inverted absolute polarity, the XLR jacks being wired with pin 3 hot, the opposite of the AES standard. The balanced output impedance was a fairly low 455 ohms at low and middle frequencies, rising inconsequentially to 513 ohms at the top of the audioband. The unbalanced output impedance was a low 239 ohms at 20Hz and 220 ohms at 1kHz, and an even lower 39 ohms at 20kHz.
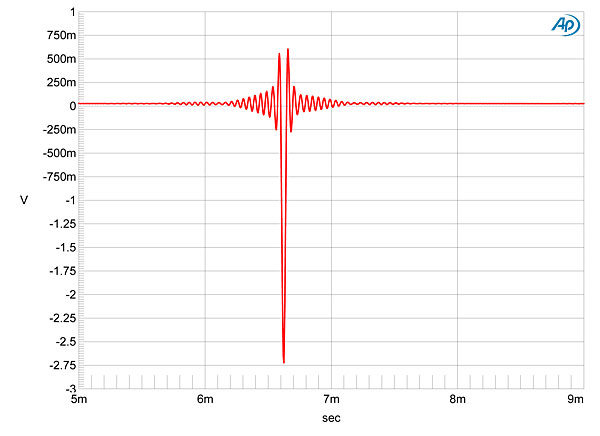
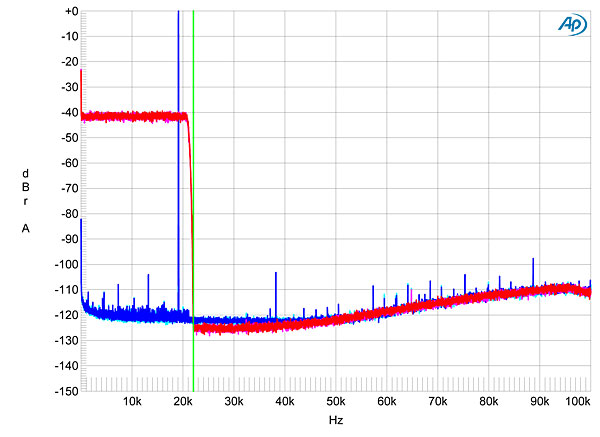
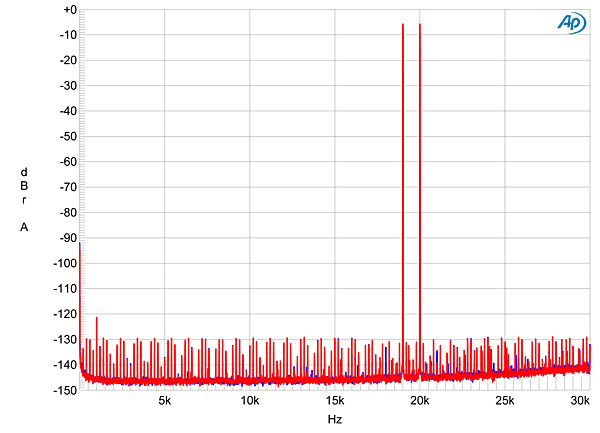
The Sony's impulse response with data sampled at 44.1kHz was reproduced in inverted polarity (fig.1), and the time-symmetrical ringing to either side of the impulse indicates that it uses a linear-phase digital reconstruction filter. A wideband spectral analysis of the HAP-Z1ES's output while it decoded 44.1kHz data representing white noise at –4dBFS (fig.2, cyan and red traces) suggests that this filter has a null at half the sample rate, indicated by the green vertical line (footnote 1). The filter totally suppresses the image at 25kHz of a full-scale tone at 19.1kHz (fig.2, blue, magenta), and the second and third harmonics of this tone are very low in level, at –103 and –109dB, respectively. The Sony's internal transcoding of PCM data to DSD results in an ultrasonic noise floor that rises with frequency with both signals in this graph, but only to a moderate extent.
Footnote 1: My thanks to Jürgen Reis of MBL for suggesting this way of plotting the behavior of a reconstruction filter.—John Atkinson
Fig.1 Sony HAP-Z1ES, impulse response (4ms time window).
Fig.2 Sony HAP-Z1ES, wideband spectrum of white noise at –4dBFS (left channel cyan, right red) and 19.1kHz tone at 0dBFS (left blue, right magenta), with data sampled at 44.1kHz (20dB/vertical div.).
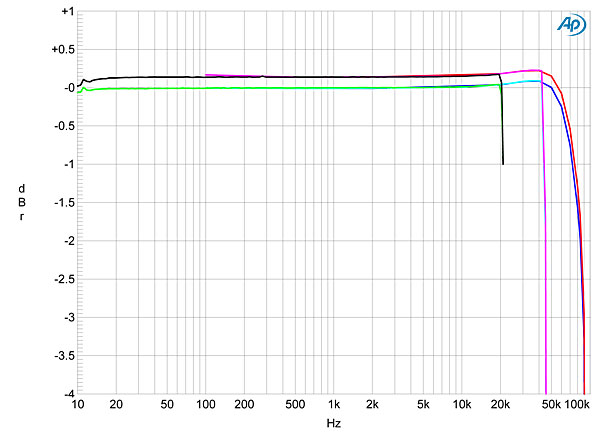
The HAP-Z1ES's frequency responses with 44.1, 96, and 192kHz data are shown in fig.3. With the two lower sample rates, the output drops like a stone just below each Nyquist frequency (ie, half the sample rate), but the rolloff is gentler with 192kHz data, reaching –10dB at 92kHz. There is a very slight rise in response just below the rolloff with the two higher sample rates. This was with the balanced output; the rise was absent with the unbalanced output. Channel separation (not shown) was superb at 1kHz: 132dB in both directions, and still 114dB at 20kHz. The low-frequency noise floor was free from spuriae, other than a tiny amount of 120Hz in the left channel; at –139dB, this will be completely inaudible under all conditions!
Fig.3 Sony HAP-Z1ES, frequency response at –12dBFS into 100k ohms with data sampled at: 44.1kHz (left channel green, right gray), 96kHz (left cyan, right magenta), 192kHz (left blue, right red) (0.5dB/vertical div.).
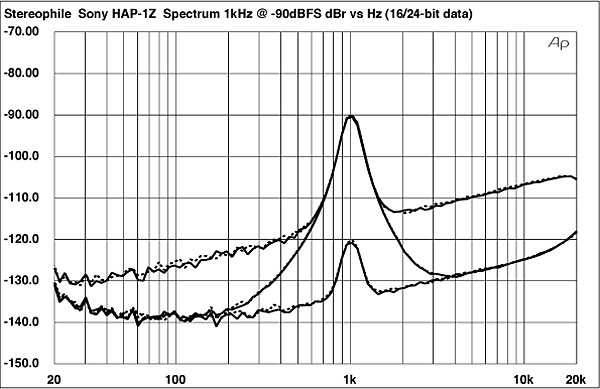
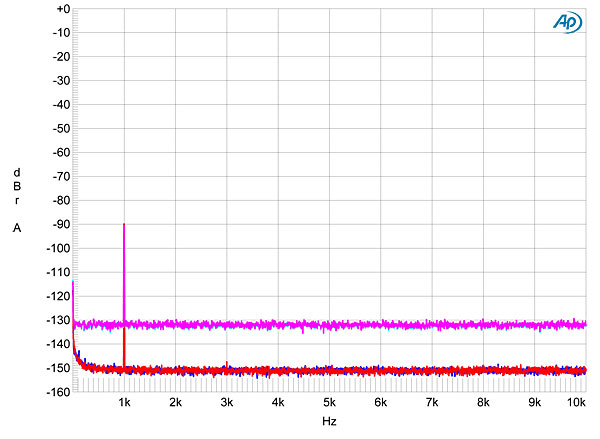
For consistency with my measurements of digital components going back to 1989, my first test of a product's resolution is to play first dithered 16-bit data, then dithered 24-bit data, both representing a 1kHz tone at –90dBFS, while I sweep a 1/3-octave bandpass filter from 20kHz to 20Hz. The result with the Sony and 16-bit data is shown as the top pair of traces in fig.4; all that can be seen, other than the peak at 1kHz that peaks at precisely –90dB, is the spectrum of the dither noise used to encode the signal. With 24-bit data (middle traces), the noise floor drops to unmask the Sony's own analog noise, which is almost at the 20-bit level, and easily enough to resolve a 1kHz tone at –120dBFS (bottom traces). Repeating this analysis with a more modern FFT technique gives similarly good pictures (figs.5 & 6).
Fig.4 Sony HAP-Z1ES, 1/3-octave spectrum with noise and spuriae of dithered 1kHz tone at –90dBFS with 16-bit data (top) and 24-bit data (middle), and at –120dBFS with 24-bit data (bottom) (right channel dashed).
Fig.5 Sony HAP-Z1ES, spectrum with noise and spuriae of dithered 1kHz tone at –90dBFS with: 16-bit data (left channel cyan, right magenta), 24-bit data (left blue, right red) (20dB/vertical div.).
Fig.6 Sony HAP-Z1ES, spectrum with noise and spuriae of dithered 1kHz tone at –120dBFS with 24-bit data (left channel blue, right red) (20dB/vertical div.).
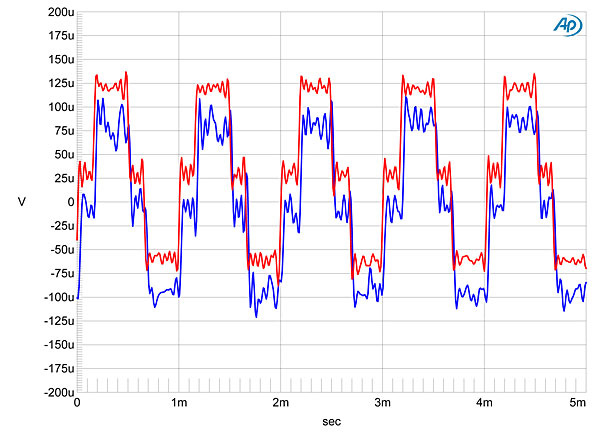
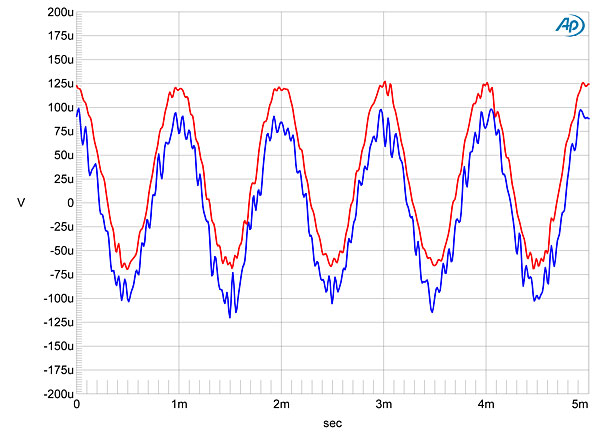
With its high resolution, excellent linearity, and low noise, the HAP-Z1ES's reproduction of an undithered tone at exactly –90.31dBFS (fig.7) was essentially perfect: the waveform is symmetrical, the Gibbs Phenomenon "ringing" on the tops and bottoms of the waveform is clearly evident, and the three DC voltage levels described by the data are perfectly resolved. Though a touch (25µV) of DC offset is visible in the right channel (red trace), this is negligible. Increasing the bit depth to 24 gave a superbly defined sinewave (fig.8).
Fig.7 Sony HAP-Z1ES, waveform of undithered 1kHz sinewave at –90.31dBFS, 16-bit data (left channel blue, right red).
Fig.8 Sony HAP-Z1ES, waveform of undithered 1kHz sinewave at –90.31dBFS, 24-bit data (left channel blue, right red).
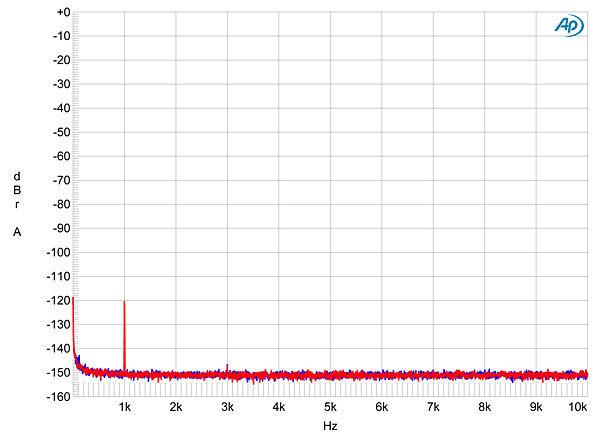
As implied by fig.2, the Sony offered very low distortion. With a full-scale 50Hz tone (fig.9), the subjectively innocuous third harmonic was the highest in level, at just –117dB (0.00017%), with traces of second and fifth harmonic visible at even lower levels. This graph was taken into 100k ohms; with the demanding 600 ohm load, the third harmonic rose to –110dB (0.0003%), but there was otherwise no change in the spectrum. Tested for intermodulation with an equal mix of 19 and 20kHz tones, and with the combined waveform peaking at 0dBFS, there was very little distortion (fig.10), though the noise floor took on a rather granular appearance.
Fig.9 Sony HAP-Z1ES, balanced outputs, spectrum of 50Hz sinewave, DC–1kHz, at 0dBFS into 100k ohms (left channel blue, right red; linear frequency scale).
Fig.10 Sony HAP-Z1ES, balanced outputs, HF intermodulation spectrum, DC–30kHz, 19+20kHz at 0dBFS into 100k ohms (left channel blue, right red; linear frequency scale).
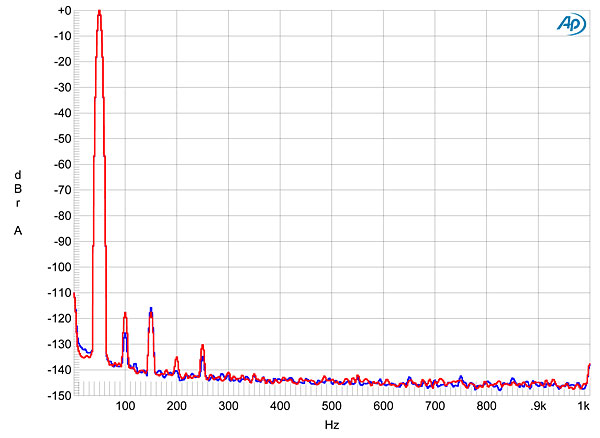
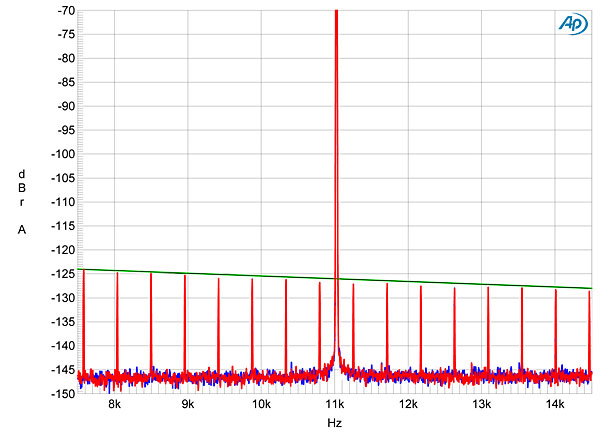
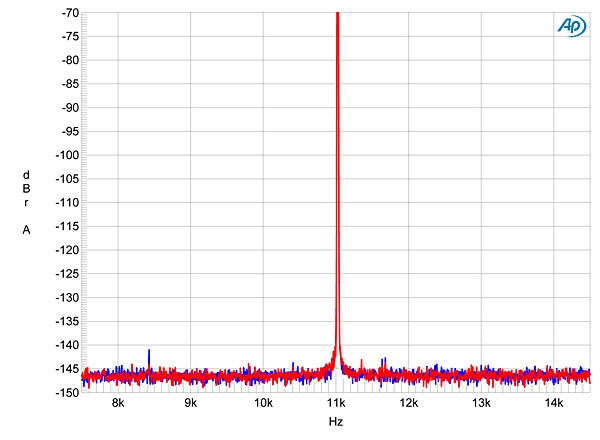
The Miller-Dunn J-Test signal is not formally diagnostic for testing for jitter with digital systems like the HAP-Z1ES, where the clock is not embedded in the data. Nevertheless, I still perform tests with it on such systems because it sometimes reveals other problems. The result with 16-bit J-Test data is shown in fig.11. No jitter-related components are visible, and the low-level, odd-order harmonics of the low-frequency, LSB-level squarewave all lie very close to their correct levels (indicated by a green line). These harmonics disappear as expected with 24-bit J-Test data, leaving an almost perfectly clean spectrum (fig.12).
Fig.11 Sony HAP-Z1ES, high-resolution jitter spectrum of analog output signal, 11.025kHz at –6dBFS, sampled at 44.1kHz with LSB toggled at 229Hz: 16-bit data (left channel blue, right red). Center frequency of trace, 11.025kHz; frequency range, ±3.5kHz.
Fig.12 Sony HAP-Z1ES, high-resolution jitter spectrum of analog output signal, 11.025kHz at –6dBFS, sampled at 44.1kHz with LSB toggled at 229Hz: 24-bit data (left channel blue, right red). Center frequency of trace, 11.025kHz; frequency range, ±3.5kHz.
This is impressive measured performance from a well-engineered, truly high-resolution digital component. I share KR's enthusiasm for Sony's HAP-Z1ES.—John Atkinson
Footnote 1: My thanks to Jürgen Reis of MBL for suggesting this way of plotting the behavior of a reconstruction filter.—John Atkinson