I tested the Luxman M-10X with my Audio Precision SYS2722 system. I preconditioned the amplifier by following the CEA's recommendation of operating it at one-eighth the specified power into 8 ohms for 30 minutes. At the end of that time, the grilles over the internal heatsinks were hot, at 120.6°F (49.3°C), though the top panel was just warm at 90.9°F (32.8°C). Operating the amplifier for another 30 minutes at one-third the specified power, a level that results in the maximum heat dissipation in the output devices, increased the temperatures only slightly. The M-10X has sufficient heatsink capacity for its rated power.
The Luxman's voltage gain is specified as 29dB, presumably into 8 ohms, which was confirmed by my measurements. The amplifier preserved absolute polarity (ie, was noninverting) with the unbalanced input and the rear-panel Phase Inversion switch set to Normal. However, the M-10X inverted polarity with the balanced input with the Normal setting of the switch, which implies that the XLR jacks are wired with pin 3 positive rather than pin 2, the opposite of the AES convention. (As I wrote in the main text, the phase can be inverted with a back-panel switch.)
The balanced input impedance was usefully high, at 54k ohms at 20Hz and 1kHz, dropping to 26k ohms at 20kHz. The lower-frequency impedances are almost twice the specified 28k ohms, which suggests that the latter refers to the impedance of each signal phase. The unbalanced input impedance was 46k ohms at low and middle frequencies, rising to the specified 51k ohms at the top of the audioband.
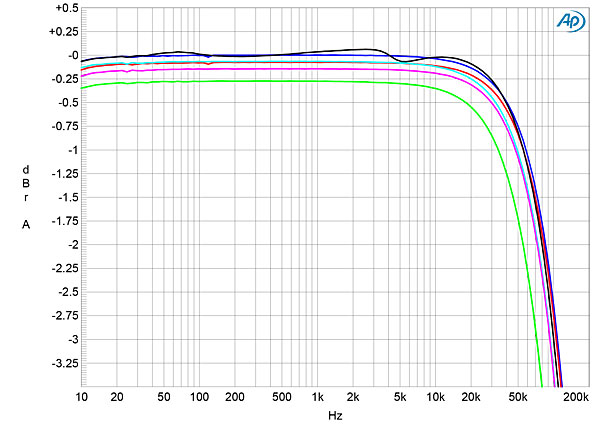
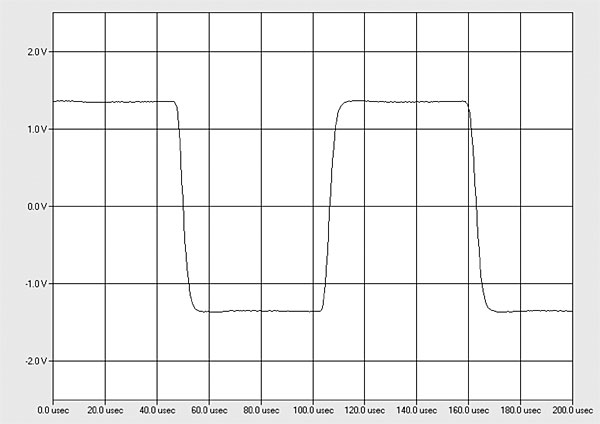
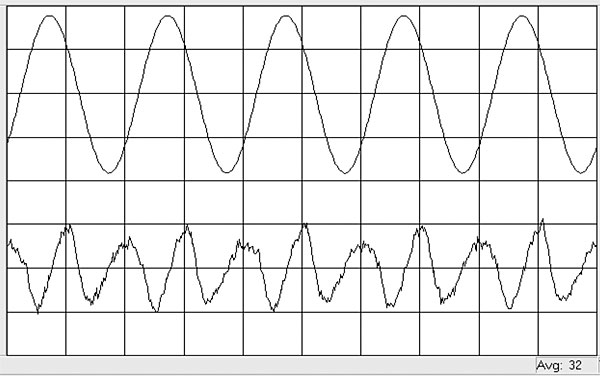
The Luxman's output impedance was a very low 0.06 ohm at 20Hz and 1kHz, increasing slightly to 0.09 ohm at 20kHz. (These impedances include the series impedance of 6' of spaced-pair loudspeaker cable.) The modulation of the amplifier's frequency response due to the Ohm's law interaction between this source impedance and the impedance of our standard simulated loudspeaker was negligible, at ±0.1dB (fig.1, gray trace). The response into an 8 ohm resistive load (fig.1, blue and red traces) was down by 3dB just above 100kHz and flat to 20kHz, which correlates with the M-10X's superb reproduction of a 10kHz squarewave (fig.2). Commendably, there was no overshoot or ringing in the squarewave response.
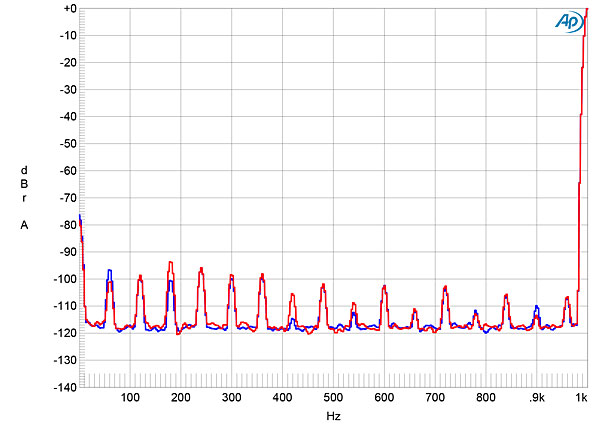
Channel separation was close to 90dB in both directions below 2kHz, dropping insignificantly to 80dB at the top of the audioband. Measured with the unbalanced inputs shorted to ground, the amplifier's unweighted, wideband signal/noise ratio was an excellent 83dB ref. 1W into 8 ohms (average of both channels). This ratio improved to 93.8dB when the measurement was A-weighted and to 115.6dB when referenced to the amplifier's specified maximum power. This is very close to the specification of 117dB(A). Spuriae at the 60Hz power-supply frequency and its harmonics were present in the Luxman's noisefloor (fig.3) but were negligible at close to –100dB ref. 1W into 8 ohms.
In stereo mode—I didn't look at the amplifier's behavior in bridged-mono mode—the Luxman M-10X is specified as being able to deliver 150Wpc into 8 ohms and 300W into 4 ohms (both powers equivalent to 21.76dBW). With both channels driven and using our definition of clipping, which is when the output's percentage of THD+noise reaches 1%, the Luxman exceeded its specified powers, clipping with a 1kHz signal at 202W into 8 ohms (23.05dBW, fig.4) and at 350W into 4 ohms (22.43dBW, fig.5). At 1W into 8 ohms, the front-panel meters indicated "–25dB" ref. 0dB, and at 50W into 8 ohms they indicated "–9dB."
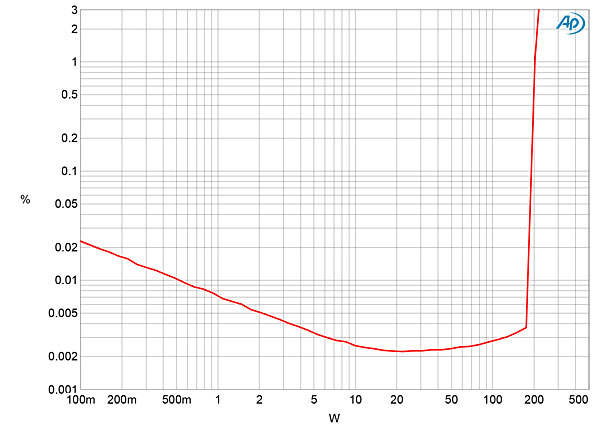
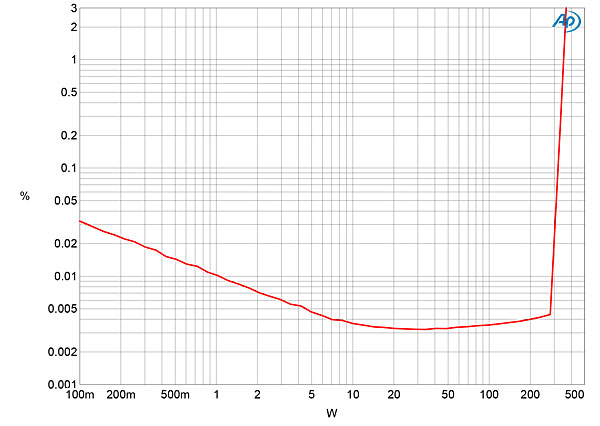
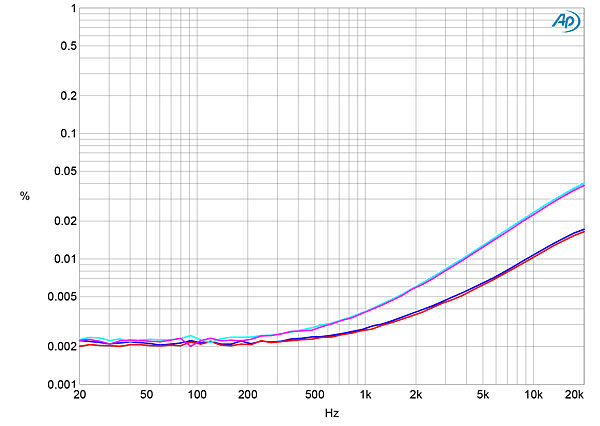
The shape of the traces in figs.4 and 5 suggests that the measured THD+N percentage below 20W is dominated by noise. I therefore examined how the percentage of THD+noise changed with frequency at 20V, which is equivalent to 50W into 8 ohms and 100W into 4 ohms. The THD+N was very low in the bass and midrange into 8 and 4 ohms (fig.6) then rising at higher frequencies, more so into 4 ohms (cyan and magenta traces) than into 8 ohms (blue and red traces). Nevertheless, the THD+N only reached the specified 0.04% with 20kHz at 100W into 4 ohms.
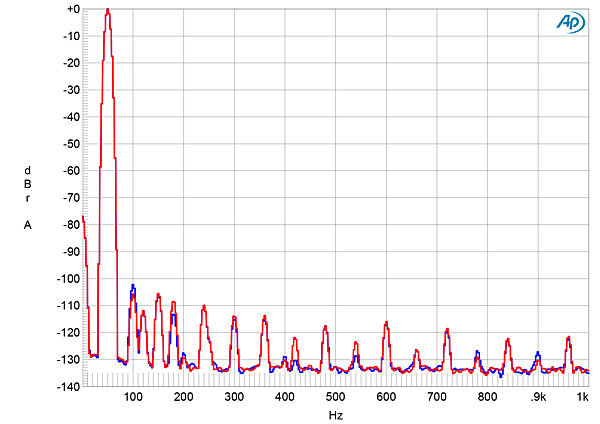
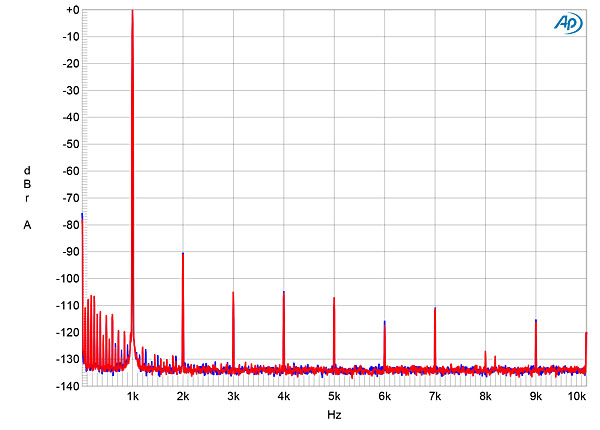
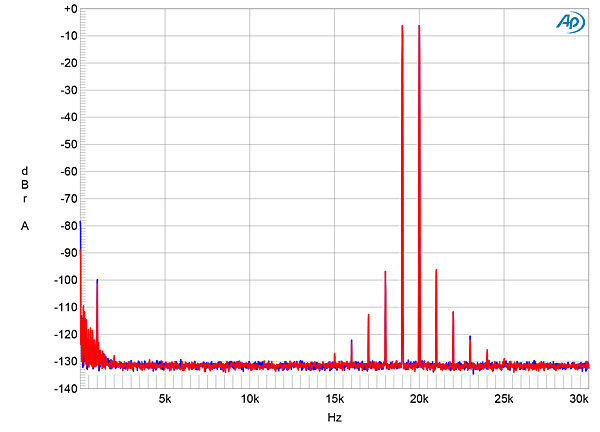
The Luxman's distortion was predominantly the subjectively innocuous second harmonic (fig.7), with the third harmonic a little lower in level (fig.8). This spectrum was taken with the amplifier driving 50Wpc into 8 ohms; the second harmonic in the left channel lay at a low –103dB (0.0007%). With a 1kHz signal at 100Wpc into 4 ohms, it rose to a still very low –90dB (0.003%, fig.9). When the amplifier drove an equal mix of 19 and 20kHz tones at 100W into 8 ohms (fig.10), the second-order difference product at 1kHz lay at a very low –100dB (0.001%), with higher-order intermodulation products close to the same level. At the same voltage into 4 ohms, these distortion products only rose slightly in level.
The Luxman M-10X offers superb measured performance.—John Atkinson