Sidebar 4: iFi ZenDAC Signature V2 Measurements
Turning to the ZEN DAC Signature, I measured both the original version, serial number 5502000155, and the V2 version with which JMu did most of her auditioning, which had the serial number 5320000008. The two versions measured identically in all but one respect, which was the maximum output level in variable gain mode. The V2's maximum output in this mode was 2.07V balanced and 1.04V unbalanced, both values 6dB lower than the maximum outputs in fixed gain mode. While the original ZEN DAC's maximum levels in fixed mode were almost identical to those of the V2, at 4.3V balanced and 2.2V unbalanced, the maximum levels in variable mode were 6.7V and 3.35V, respectively. Distortion was very high at these levels, with crossover artefacts visible on the oscilloscope. The V2's reduction in the maximum output voltage is a desirable change.
Apple's AudioMIDI utility revealed that the iFi's USB input accepted 16-, 24-, and 32-bit integer data sampled at rates up to 768kHz. Apple's USB Prober utility identified both ZEN DAC Signatures as "iFi (by AMR)" from "iFi (by AMR) HD USB Audio," with the serial number strings "00000000" for the original version and "0003" for the V2. The USB port operated in the optimal isochronous asynchronous mode.
Both outputs preserved absolute polarity. The output impedance at the balanced outputs was 199.7 ohms, and at the unbalanced outputs it was 99.6 ohms. Both impedances were consistent across the audioband and very close to the specified values.
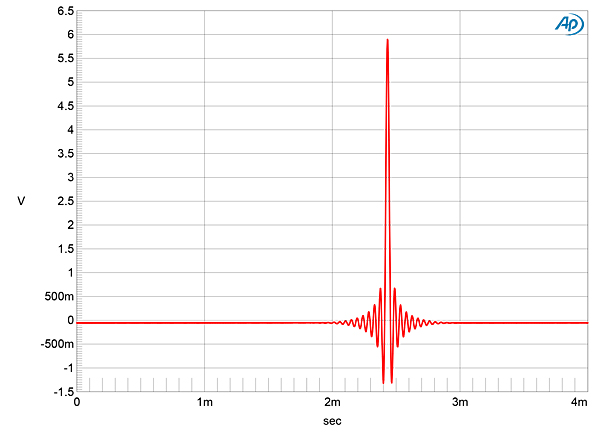
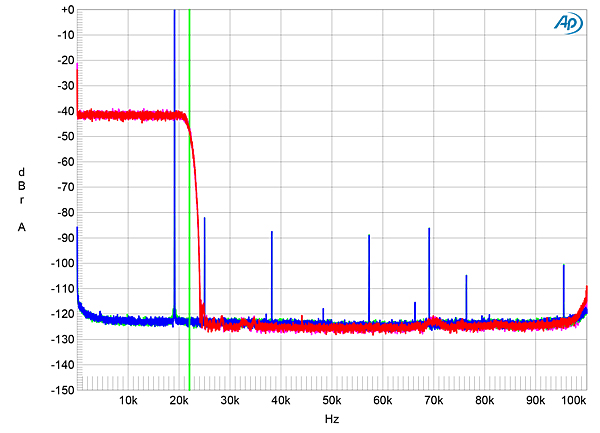
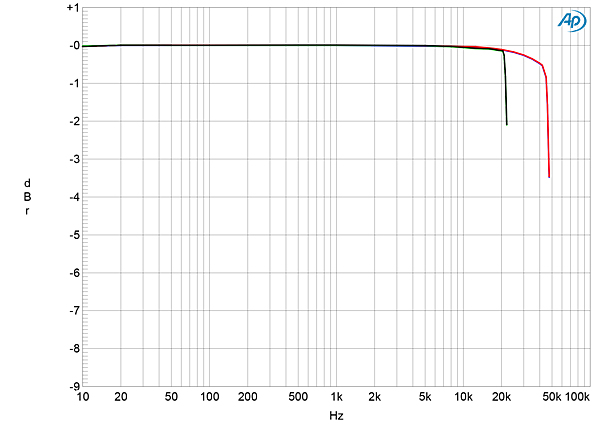
The impulse response with 44.1kHz PCM data (fig.9) indicates that the reconstruction filter is a conventional linear-phase type, with time-symmetrical ringing on either side of the single sample at 0dBFS. With 44.1kHz-sampled white noise (fig.10, red and magenta traces), the reconstruction filter's response rolled off above 20kHz, reaching full stop-band suppression at 24kHz. The aliased image at 25kHz of a full-scale 19.1kHz tone (blue and cyan traces) was suppressed by 82dB, and the distortion harmonics of the 19.1kHz tone lay close to –90dB (0.003%). The frequency response was flat in the audioband with a rolloff that started below half of each sample rate (fig.11). Channel matching was superb, and channel separation was 68dB in both directions across the audioband.
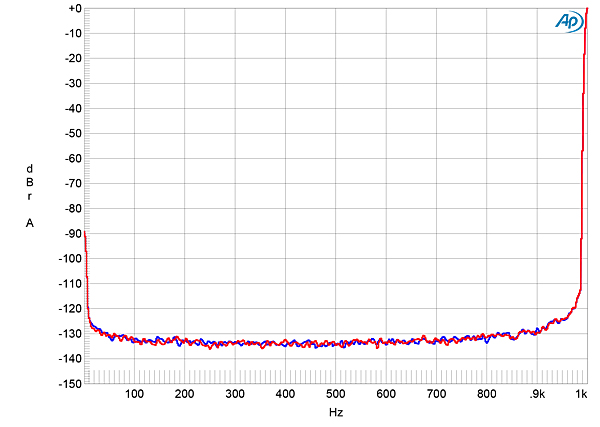
 The ZEN DAC V2 featured very low levels of harmonic distortion. With the processor's fixed-level balanced outputs reproducing a 50Hz tone at 0dBFS (fig.16), the only harmonics present were the second at –94dB (0.002%) and the third at –110dB (0.0003%). Commendably, the levels of these harmonics didn't increase when I reduced the load impedance to 600 ohms. Tested for intermodulation distortion with a mix of 19kHz and 20kHz tones, the waveform peaking at 0dBFS, a multiplicity of low-level 1kHz-spaced tones were produced (fig.17). Reducing the signal level to –3dBFS eliminated these spuriae (fig.18), revealing actual intermodulation to be very low in level—below the levels of the aliased images of the tones at 24.1kHz and 25.1kHz, in fact.
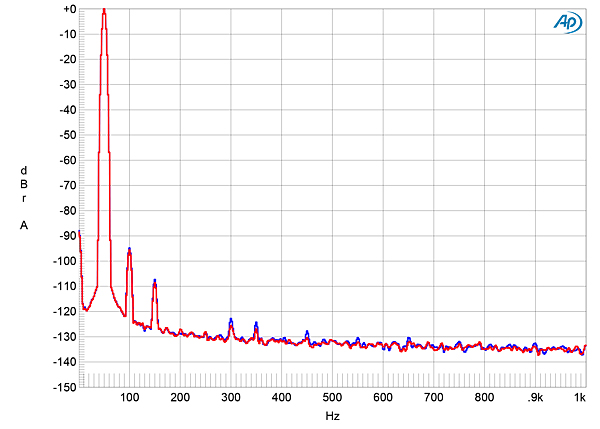
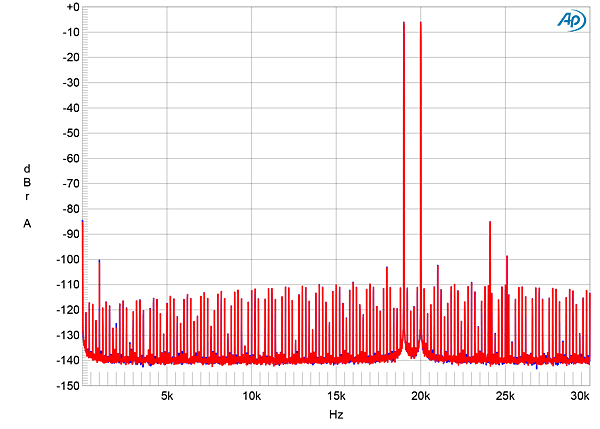
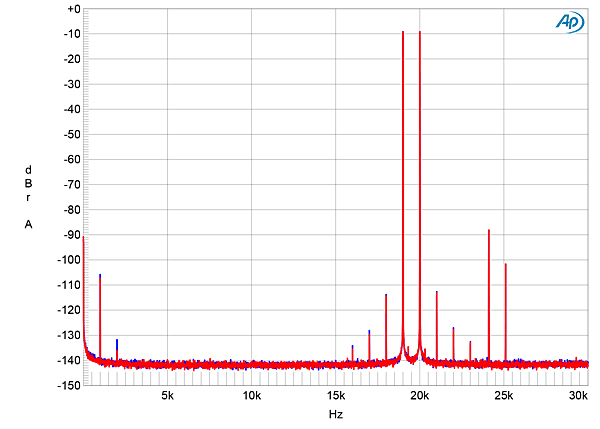
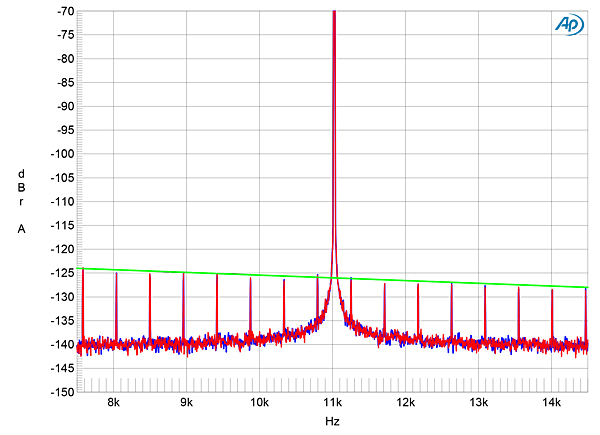
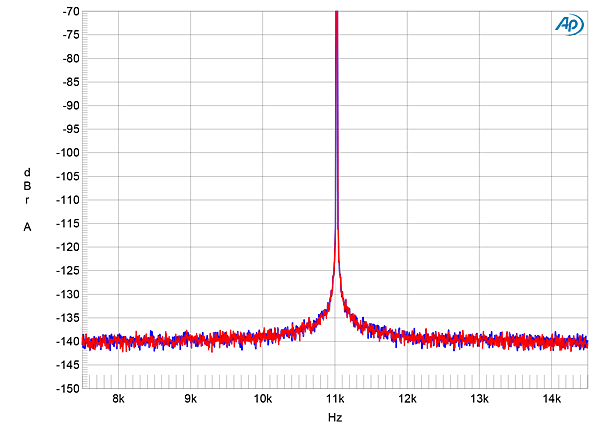
Fig.9 iFi ZenDAC Signature V2, impulse response (one sample at 0dBFS, 44.1kHz sampling, 4ms time window).
Fig.10 iFi ZenDAC Signature V2, wideband spectrum of white noise at –4dBFS (left channel red, right magenta) and 19.1kHz tone at 0dBFS (left blue, right cyan), with data sampled at 44.1kHz (20dB/vertical div.).
Fig.11 iFi ZenDAC Signature V2, frequency response at –12dBFS into 100k ohms with data sampled at: 44.1kHz (left channel green, right gray), 96kHz (left blue, right red) (1dB/vertical div.).
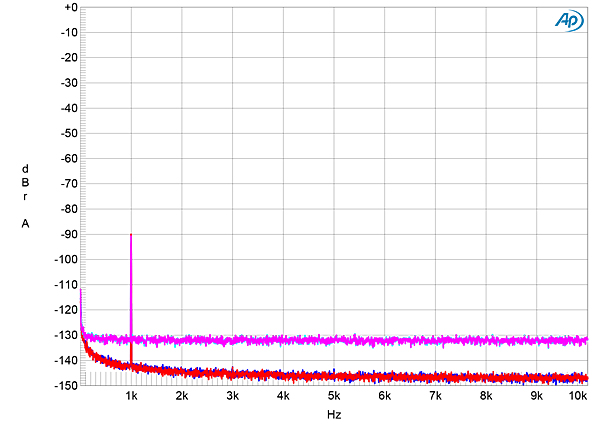
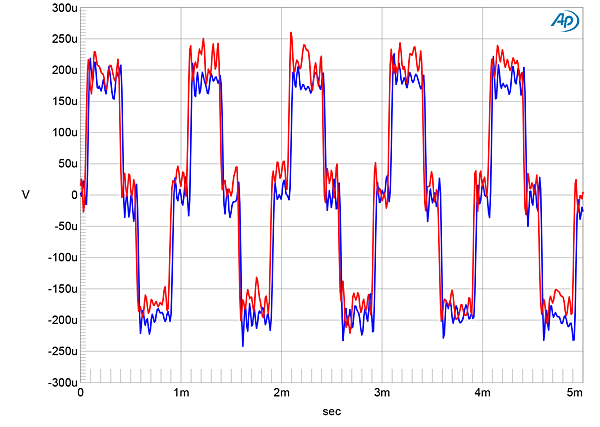
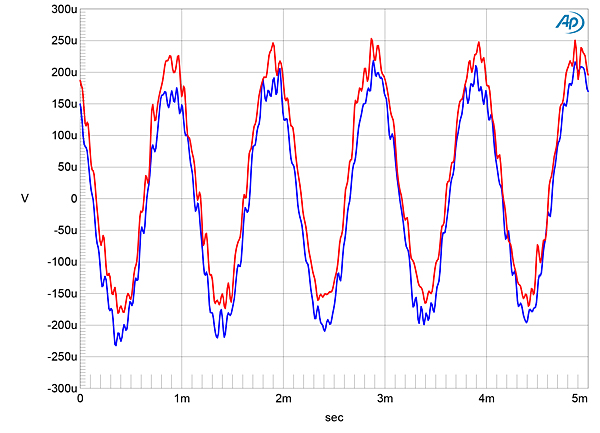
The ZEN DAC V2's noisefloor was very low in level (fig.12) and free from any power supply–related spuriae. With dithered 16- and 24-bit 1kHz tones at –90dBFS, the increase in bit depth reduced the level of the noisefloor by 18dB (fig.13), which implies that the processor has 19 bits' worth of resolution. With undithered data representing a tone at exactly –90.31dBFS (fig.14), the three DC voltage levels described by the data were well resolved, while with undithered 24-bit data (fig.15), the result was a clean sinewave.
Fig.12 iFi ZenDAC Signature V2, spectrum with noise and spuriae of dithered, 24-bit, 1kHz tone at 0dBFS (left channel blue, right red) (20dB/vertical div.).
Fig.13 iFi ZenDAC Signature V2, spectrum with noise and spuriae of dithered 1kHz tone at –90dBFS with: 16-bit data (left channel cyan, right magenta), 24-bit data (left blue, right red) (20dB/vertical div.).
Fig.14 iFi ZenDAC Signature V2, waveform of undithered 1kHz sinewave at –90.31dBFS, 16-bit data (left channel blue, right red).
Fig.15 iFi ZenDAC Signature V2, waveform of undithered 1kHz sinewave at –90.31dBFS, 24-bit data (left channel blue, right red).
Fig.16 iFi ZenDAC Signature V2, spectrum of 50Hz sinewave, DC–1kHz, at 0dBFS into 100k ohms (left channel blue, right red; linear frequency scale).
Fig.17 iFi ZenDAC Signature V2, HF intermodulation spectrum, DC–30kHz, 19+20kHz at 0dBFS peak into 100k ohms (left channel blue, right red; linear frequency scale).
Fig.18 iFi ZenDAC Signature V2, HF intermodulation spectrum, DC–30kHz, 19+20kHz at –3dBFS peak into 100k ohms (left channel blue, right red; linear frequency scale).
Testing for jitter rejection with Miller-Dunn J-Test data is not diagnostic for USB data, as the bit clock is not embedded in the data. However, it will still reveal problems like supply noise on the DAC chip's voltage reference pin. With 16-bit, 44.1kHz J-Test data, all the odd-order harmonics of the signal's LSB-level, low-frequency squarewave were very close to the correct levels (fig.19, sloping green line), and no supply-related sidebands can be seen. The central spike in this graph, which represents the high-level tone at exactly one-quarter the sample rate, has some slight broadening at its base, but this will not have any subjective consequences. The same broadening can be seen with 24-bit J-Test data (fig.20), but there are no sidebands visible.
Fig.19 iFi ZenDAC Signature V2, high-resolution jitter spectrum of analog output signal, 11.025kHz at –6dBFS, sampled at 44.1kHz with LSB toggled at 229Hz: 16-bit TosLink data (left channel blue, right red). Center frequency of trace, 11.025kHz; frequency range, ±3.5kHz.
Fig.20 iFi ZenDAC Signature V2, high-resolution jitter spectrum of analog output signal, 11.025kHz at –6dBFS, sampled at 44.1kHz with LSB toggled at 229Hz: 24-bit TosLink data (left channel blue, right red). Center frequency of trace, 11.025kHz; frequency range, ±3.5kHz.
Both versions of the iFi ZEN DAC Signature featured excellent measured performance, but the V2 offers a worthwhile improvement over the original version, due to the reduction in the variable mode's maximum output level.—John Atkinson


