Sidebar 3: Measurements
I measured the dCS Bartók using my Audio Precision SYS2722 system (see the January 2008 "As We See It"), using the Audio Precision's AES/EBU and S/PDIF digital outputs and USB data sourced from my MacBook Pro running on battery power, with Pure Music 3.0 playing WAV and AIFF test-tone files.
Apple's USB Prober utility identified the dCS processor as "dCS Bart\363k USB class 2" (footnote 1) from "Data Conversion Systems Ltd," with the serial number "2." The Bartók's USB port operated in the optimal isochronous asynchronous mode. Apple's AudioMIDI utility revealed that, via USB, the Bartók accepted 16- and 24-bit integer data sampled at all rates from 44.1 to 384kHz. The AES/EBU and coaxial and TosLink S/PDIF inputs all locked to datastreams with sample rates of up to 192kHz.
With the Bartók's volume control set to its maximum, a 1kHz digital signal at 0dBFS resulted in a balanced output level of 6.03V into 100k ohms with the output level set to "6V," 2.04V with it set to "2V," and 603mV with it set to "0.6V." The maximum levels from the unbalanced outputs were all very slightly lower and the maximum level from the headphone output was 6.82V. (Except where indicated, all measurements were taken with the "6V" setting.) All the outputs preserved absolute polarity (ie, were noninverting). The balanced output impedance was extremely low, at 1.5 ohms from 20Hz to 20kHz—half the specified 3 ohms. The headphone output impedance was even lower, at 0.7 ohms, 20Hz–20kHz, while the unbalanced output impedance was as specified, at a still-low 51 ohms.
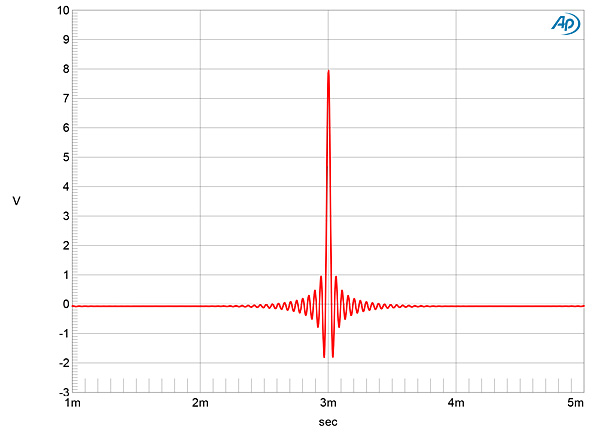
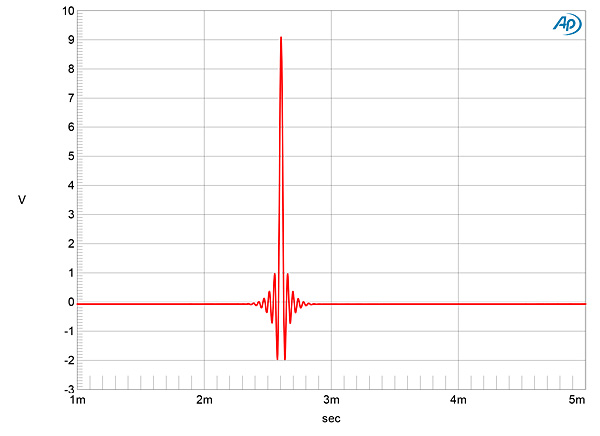
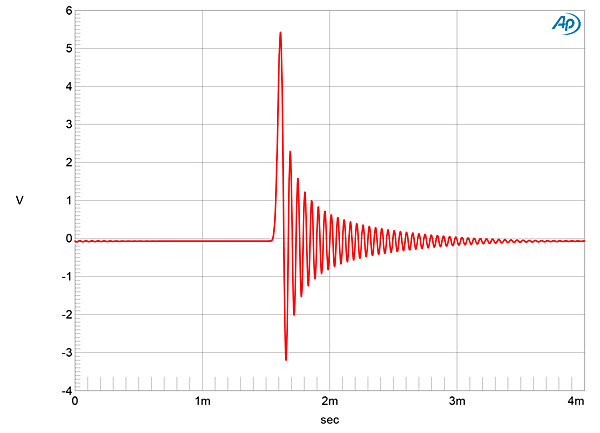
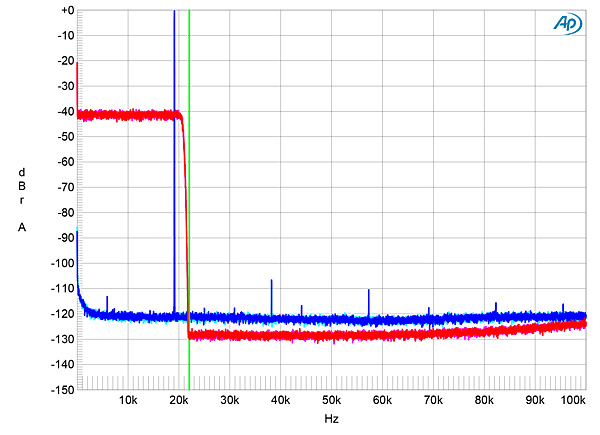
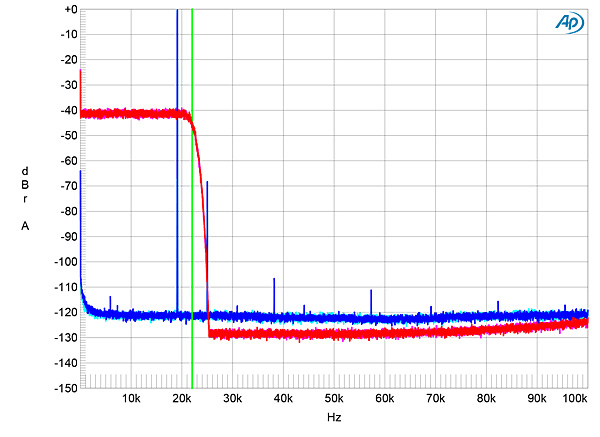
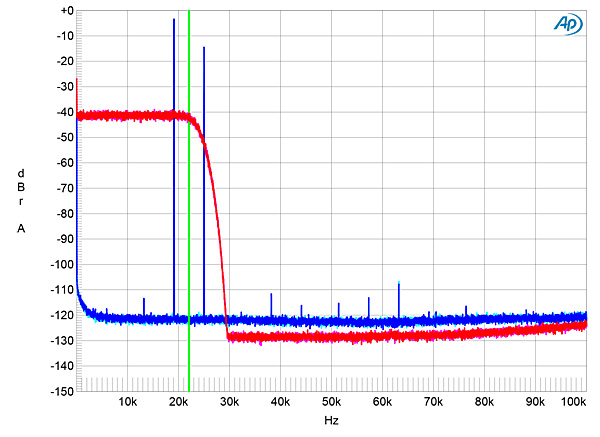
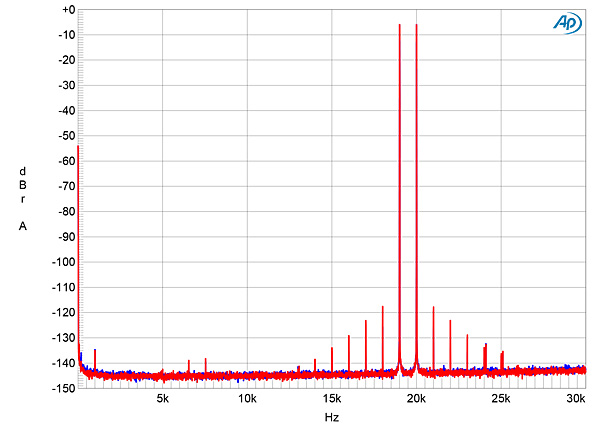
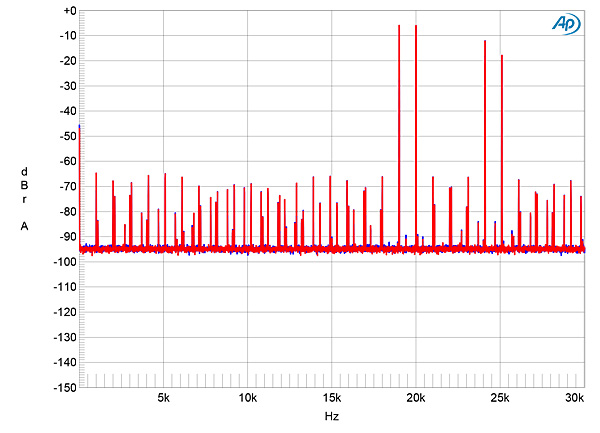
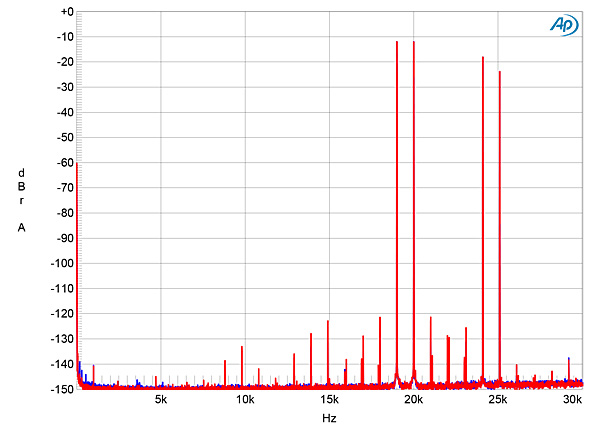
The Bartók's impulse response with 44.1kHz data depended on which reconstruction filter had been selected. F1 and F6 had relatively long, time-symmetrical, linear-phase impulse responses (fig.1), while F2, F3, and F4 were shorter linear-phase filters (fig.2). The odd man out is F5, which is a minimum-phase type, with all the ringing following the single high sample (fig.3). With 44.1kHz-sampled white noise (footnote 2), the Bartók's responses with the F5 and F6 filters (fig.4, red and magenta traces) reached full stop-band suppression at exactly half the sample rate, indicated by the vertical green line in fig.4, and are therefore apodizing types. F1 rolls off a little less quickly (not shown) but reaches full stop-band suppression a little lower in frequency than F2 (fig.5). The latter still suppresses the aliased image at 25kHz of a full-scale tone at 19.1kHz (blue and cyan traces) by almost 70dB. F3 and F4 offer increasingly slow ultrasonic rolloffs—with F4 (fig.6) I had to reduce the level of the 19.1kHz tone by 6dB to avoid the audioband noise floor being contaminated with aliasing products. The harmonics of the 19.1kHz tone all lie at or below –107dB, however.
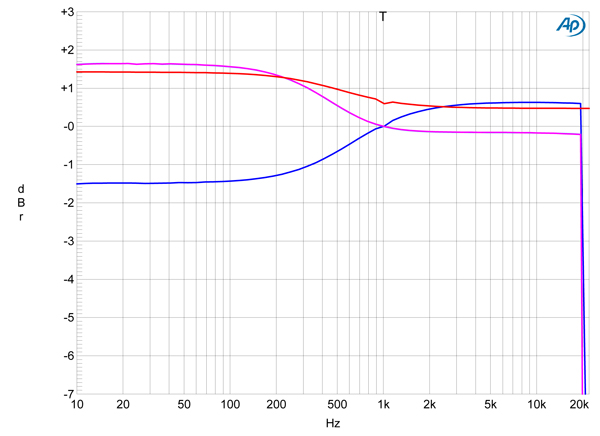
 The headphone output offers a crossfeed function intended to optimize the listening experience with headphones. I measured the effect of this by feeding the Bartók stereo data with the channels both in-phase and 180° out of phase. The result (fig.11) is similar to that with the original HeadRoom Supreme headphone amplifier (footnote 4). When a signal is the same in both channels (cyan and magenta traces), it is shelved up by around 1.5dB below 1kHz, with slightly suppressed highs. For a signal that is identical but out of phase in the two channels, this is equalized in the complementary manner (blue and red traces). Both the dCS and HeadRoom algorithms appear to be based on the work of the late Ben Bauer when he was at CBS Labs in the 1950s (footnote 5), but less extreme.
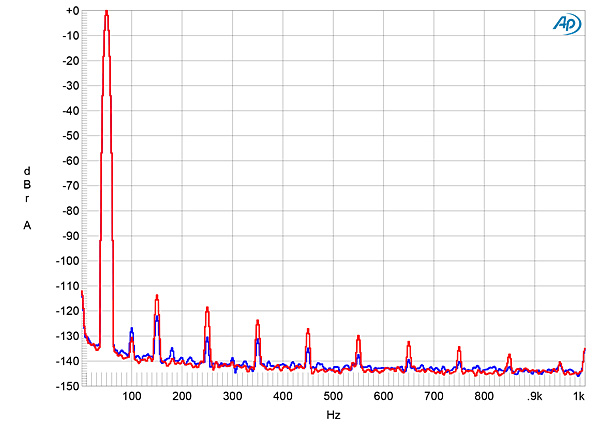
 Harmonic distortion was extremely low in level, even into 600 ohms (fig.15), the lowest impedance dCS recommends using with the Bartók's line-level outputs. The third harmonic was the highest in level in both channels, but at –122dB in the left channel (0.00008%, blue trace) and at –114dB in the right channel (0.0002%, blue trace) this is negligible. Intermodulation distortion was also extraordinarily low, with the second-order difference product produced by equal-level tones at 19 and 20kHz with the combined waveform peaking at 0dBFS, lying at –134dB (0.00002%) (fig.16). Higher-order products are a little higher in level but not so much that it matters. This graph was taken with F1, which has a fast ultrasonic rolloff; repeating the test with F5 and F6 gave identical results. However, with F2, F3, and F4, the aliased images at 24.1kHz and 25.1kHz became increasingly apparent; with F3 and F4, the 0dBFS test signal contaminated the audioband noise floor with aliasing products (fig.17). With F4, I had to reduce the peak signal level by 6dB to obtain a clean noise floor (fig.18). Fortunately, music with top-octave levels approaching 0dBFS is rare.
Footnote 1: Apple's USB Prober utility doesn't recognize Unicode text, just ASCII coded text. The "\363" is the code for ó. Footnote 2: My thanks to Jürgen Reis of MBL for suggesting this test to me. Footnote 3: See, for example, fig.6 here. Footnote 4: See fig.8 here. Footnote 5: See "Stereophonic Earphones and Binaural Loudspeakers," B.B. Bauer, Journal of the Audio Engineering Society, Vol.9 No.2, April 1961, reprinted in Stereophonic Techniques, published in 1986 by the AES.
Fig.1 dCS Bartók, F1, impulse response (one sample at 0dBFS, 44.1kHz sampling, 4ms time window).
Fig.2 dCS Bartók, F4, impulse response (one sample at 0dBFS, 44.1kHz sampling, 4ms time window).
Fig.3 dCS Bartók, F5, impulse response (one sample at 0dBFS, 44.1kHz sampling, 4ms time window).
Fig.4 dCS Bartók, F5, wideband spectrum of white noise at –4dBFS (left channel red, right magenta) and 19.1kHz tone at 0dBFS (left blue, right cyan), with data sampled at 44.1kHz (20dB/vertical div.).
Fig.5 dCS Bartók, F2, wideband spectrum of white noise at –4dBFS (left channel red, right magenta) and 19.1kHz tone at 0dBFS (left blue, right cyan), with data sampled at 44.1kHz (20dB/vertical div.).
Fig.6 dCS Bartók, F4, wideband spectrum of white noise at –4dBFS (left channel red, right magenta) and 19.1kHz tone at –3dBFS (left blue, right cyan), with data sampled at 44.1kHz (20dB/vertical div.).
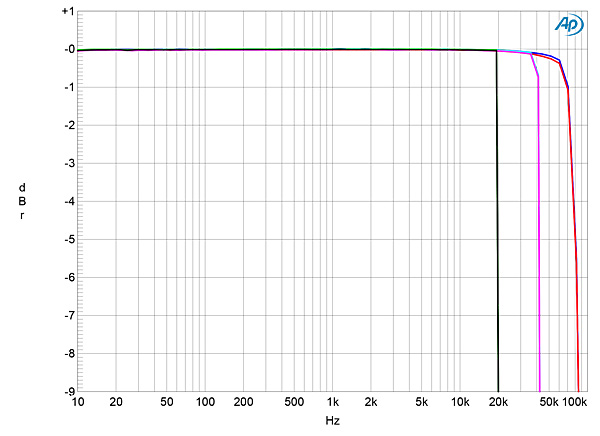
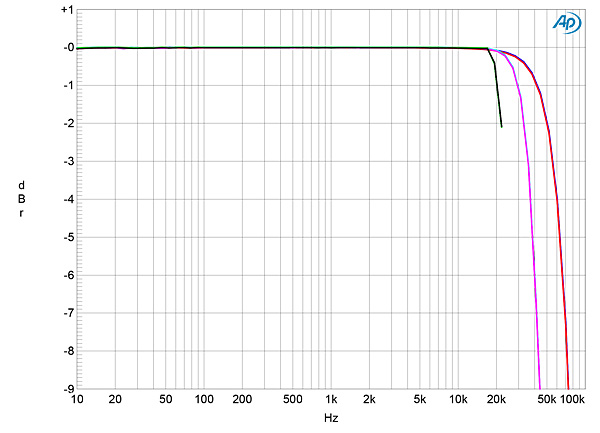
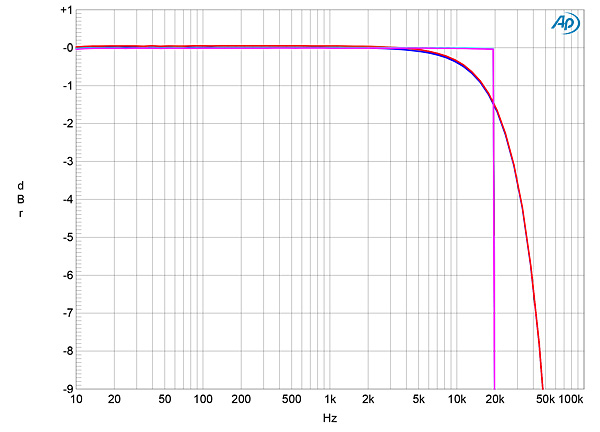
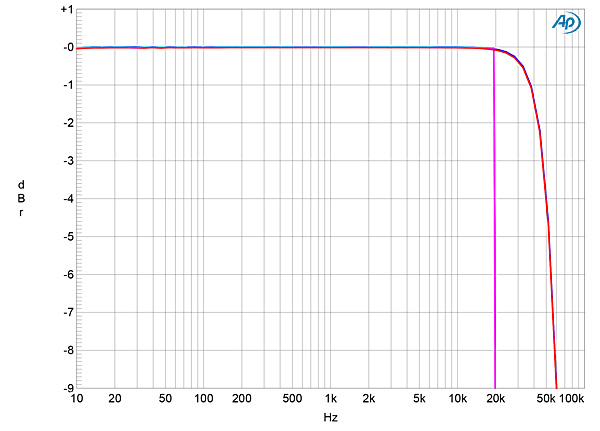
The Bartók's frequency response with F1 and data at 44.1, 96, and 192kHz rolled off sharply above half of each sample rate (fig.7). The rolloffs started earlier with the slower-rolloff filters, but even with F4, the output was flat to 17kHz or so (fig.8). Unlike the reconstruction filters found in most D/A processors, where the responses at the higher sample rates follow the same shape, flat to 20kHz, with then a slow rolloff disturbed by a steeper drop at each Nyquist frequency (footnote 3), fig.7 and fig.8 indicate that each filter is optimized for each sample rate. Peculiarly, while F5 and F6 were functional at the 44.1kHz and 192kHz sample rates, they weren't available at 96kHz. Both these filters offer steep rolloffs above 20kHz, but F5 was down by 1.5dB at 20kHz with 192kHz data (fig.9). F6's output with 192kHz data was flat to 20kHz and down by 3dB at 48kHz (fig.10).
Fig.7 dCS Bartók, F1, frequency response at –12dBFS into 100k ohms with data sampled at: 44.1kHz (left channel green, right gray), 96kHz (left cyan, right magenta), 192kHz (left blue, right red) (1dB/vertical div.).
Fig.8 dCS Bartók, F4, frequency response at –12dBFS into 100k ohms with data sampled at: 44.1kHz (left channel green, right gray), 96kHz (left cyan, right magenta), 192kHz (left blue, right red) (1dB/vertical div.).
Fig.9 dCS Bartók, F5, frequency response at –12dBFS into 100k ohms with data sampled at: 44.1kHz (left channel cyan, right magenta), 192kHz (left blue, right red) (1dB/vertical div.).
Fig.10 dCS Bartók, F6, frequency response at –12dBFS into 100k ohms with data sampled at: 44.1kHz (left channel cyan, right magenta), 192kHz (left blue, right red) (1dB/vertical div.).
Fig.11 dCS Bartók, F1, Headphone output, Crossfeed response at –12dBFS into 100k ohms with data sampled at 44.1kHz with channels in-phase (left channel cyan, right magenta) and 180° out of phase (left blue, right red) (1dB/vertical div.).
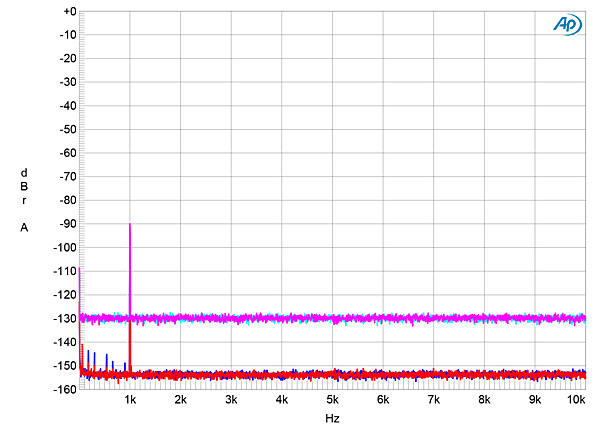
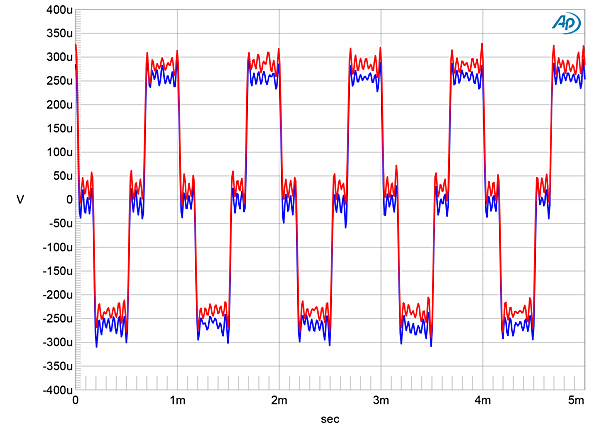
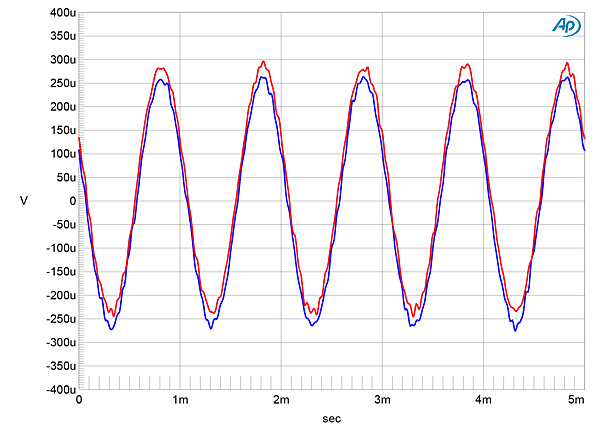
Channel separation was superb, at >123dB in both directions below 1kHz, and still 100dB, L–R, and 118dB, R–L, at 20kHz. The low-frequency noise floor was both low in level and almost completely free from any power-supply–related artifacts. When I increased the bit depth from 16 to 24 with a dithered 1kHz tone at –90dBFS (fig.12), the noise floor dropped by 25dB, meaning that the Bartók offers more than 20 bits' worth of resolution, which is close to the state of the art. With undithered data representing a tone at exactly –90.31dBFS, the three DC voltage levels described by the data were well resolved and the waveform was perfectly symmetrical (fig.13). With undithered 24-bit data, the result was a superbly clean sinewave (fig.14).
Fig.12 dCS Bartók, spectrum with noise and spuriae of dithered 1kHz tone at –90dBFS with: 16-bit data (left channel cyan, right magenta), 24-bit data (left blue, right red) (20dB/vertical div.).
Fig.13 dCS Bartók, waveform of undithered 1kHz sinewave at –90.31dBFS, 16-bit data (left channel blue, right red).
Fig.14 dCS Bartók, waveform of undithered 1kHz sinewave at –90.31dBFS, 16-bit data (left channel blue, right red).
Fig.15 dCS Bartók, spectrum of 50Hz sinewave, DC–1kHz, at 0dBFS into 600 ohms (left channel blue, right red; linear frequency scale).
Fig.16 dCS Bartók, F1, HF intermodulation spectrum, DC–30kHz, 19+20kHz at 0dBFS into 100k ohms, 44.1kHz data (left channel blue, right red; linear frequency scale).
Fig.17 dCS Bartók, F4, HF intermodulation spectrum, DC–30kHz, 19+20kHz at 0dBFS into 100k ohms, 44.1kHz data (left channel blue, right red; linear frequency scale).
Fig.18 dCS Bartók, F4, HF intermodulation spectrum, DC–30kHz, 19+20kHz at –6dBFS into 100k ohms, 44.1kHz data (left channel blue, right red; linear frequency scale).
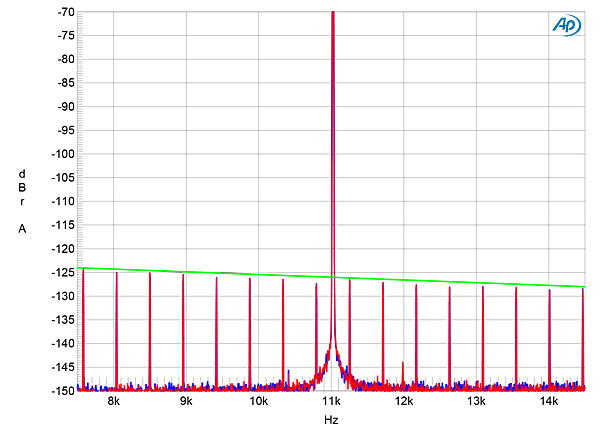
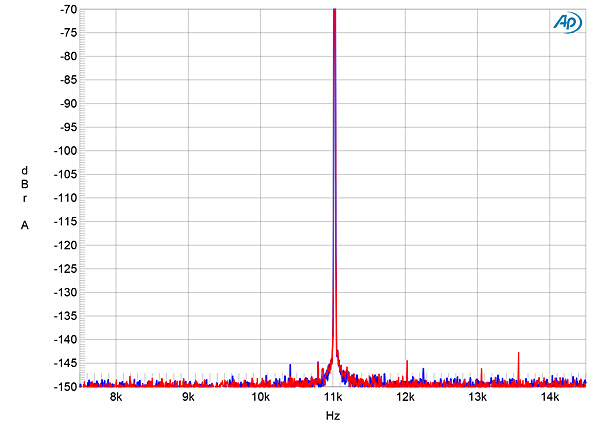
Tested for its rejection of word-clock jitter with 16-bit TosLink data, the Bartók gave superb results: All the odd-order harmonics of the LSB-level, low-frequency squarewave were at the correct levels (fig.19, sloping green line), and there was very little broadening of the peak that represents the high-level tone at one-quarter the sample rate. With 24-bit J-Test data, the result was a clean noise floor (fig.20).
Fig.19 dCS Bartók, high-resolution jitter spectrum of analog output signal, 11.025kHz at –6dBFS, sampled at 44.1kHz with LSB toggled at 229Hz: 16-bit TosLink data (left channel blue, right red). Center frequency of trace, 11.025kHz; frequency range, ±3.5kHz.
Fig.20 dCS Bartók, high-resolution jitter spectrum of analog output signal, 11.025kHz at –6dBFS, sampled at 44.1kHz with LSB toggled at 229Hz: 24-bit TosLink data (left channel blue, right red). Center frequency of trace, 11.025kHz; frequency range, ±3.5kHz.
As with the more-expensive dCS digital processors I have tested, the dCS Bartók offers state-of-the-art measured performance. In this crusty old engineer's view, "dCS" means "Digital Done Right!"—John Atkinson
Footnote 1: Apple's USB Prober utility doesn't recognize Unicode text, just ASCII coded text. The "\363" is the code for ó. Footnote 2: My thanks to Jürgen Reis of MBL for suggesting this test to me. Footnote 3: See, for example, fig.6 here. Footnote 4: See fig.8 here. Footnote 5: See "Stereophonic Earphones and Binaural Loudspeakers," B.B. Bauer, Journal of the Audio Engineering Society, Vol.9 No.2, April 1961, reprinted in Stereophonic Techniques, published in 1986 by the AES.