Sidebar 3: Measurements
I tested the CH Precision D1.5 SACD/CD player/transport with my Audio Precision SYS2722 system. As the D1.5 doesn't have digital inputs, I assessed its performance, using its own power supply and internal clock, with a Sony test SACD and a CD-R with 16-bit test signals.
I used the Pierre Verany Digital Test CD, which has gaps of various lengths in the data spiral, to check the D1.5's error correction. The Compact Disc Standard requires only that a player cope with gaps of up to 0.2mm in length, but the D1.5 played the tracks with gaps up to 2mm without audible glitches, which is excellent performance. However, the player wouldn't read the disc when a single gap was 3mm long or there was a succession of two gaps, each 2.4mm long.
The D1.5's output with a 1kHz signal at 0dBFS was 3.71V, balanced, and 1.85V, unbalanced, with both CD and SACD data. The balanced output impedance was a low 69 ohms from 20Hz to 20kHz. The single-ended output impedance was an even lower 31 ohms, again at all audio frequencies. The CH Precision's impulse response (fig.1) indicates that the player doesn't invert absolute polarity and that its reconstruction filter is a minimum-phase type, with all the ringing following the single sample at 0dBFS on the test CD track.
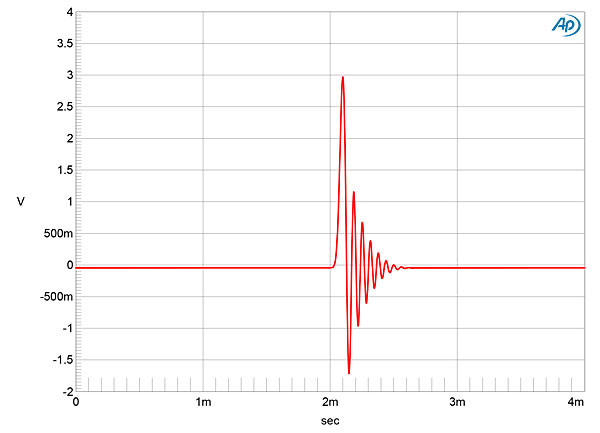
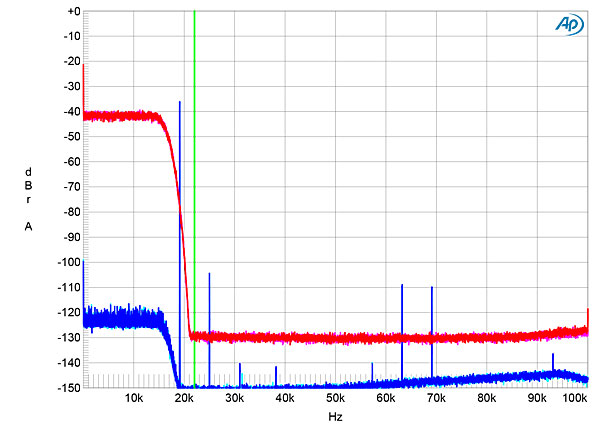
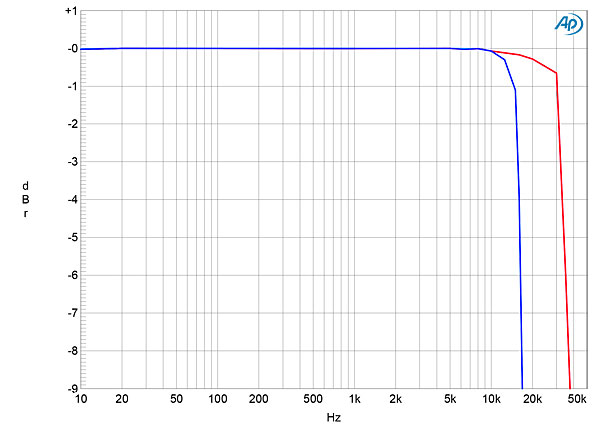
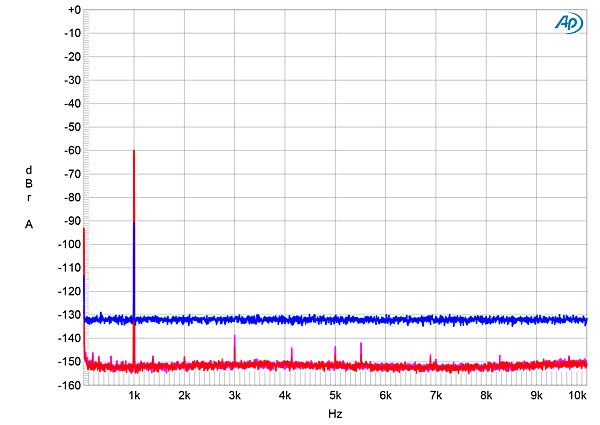
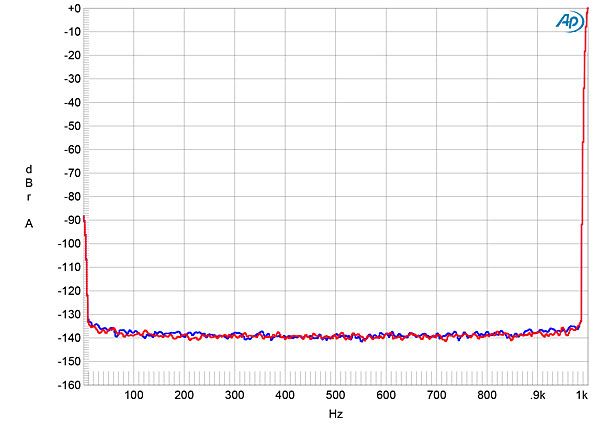 Fig.5 shows the D1.5's output spectrum with a dithered 1kHz tone at –90dBFS from the CD (cyan and blue traces) and with a 1kHz tone at –60dBFS from the SACD (magenta and red traces). With the 16-bit data, the noisefloor is actually that of the dither. With the SACD data, the noisefloor drops by 20dB, which suggests a resolution of slightly more than 19 bits, and the third harmonic makes an appearance. With undithered 16-bit data representing a tone at exactly –90.31dBFS (fig.6), the three DC voltage levels described by the data were well resolved, the waveform was perfectly symmetrical, and the minimum-phase ringing at the bit transitions is visible.
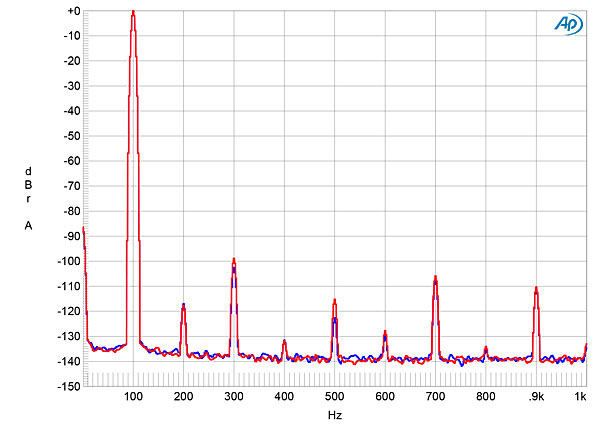
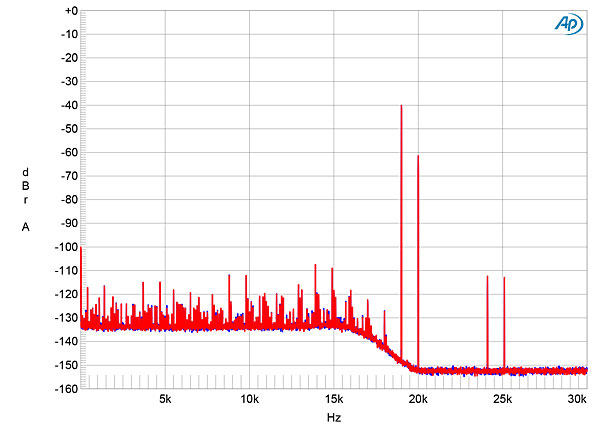
 The CH Precision player featured very low levels of harmonic distortion, with the third harmonic the highest in level at –100dB with SACD data (fig.7). The level of this harmonic didn't increase when I reduced the load to 600 ohms. For consistency with Stereophile's measurements of digital products, I have showed the spectrum of the D1.5's output while it reproduced a mix of equal levels of 19 and 20kHz tones, the signal peaking at 0dBFS (fig.8). (The test signal was from CD-R, as the test SACD didn't include this signal.) The aliased images of the tones at 24.1kHz and 25.1kHz can be seen, but with the premature rolloff of the player's CD reconstruction filter, there are no intermodulation products visible. As was seen in fig.2, the ultrasonic noisefloor is almost 20dB lower in level than that in the audioband, which makes me wonder if there is also an analog low-pass filter present with CD playback.
 I tested the D1.5's rejection of word-clock jitter with the undithered Miller-Dunn J-Test signal. The CH Precision reproduced the odd-order harmonics of the LSB-level, low-frequency squarewave very close to the correct levels (fig.9, sloping green line), and no other sidebands were present.

Footnote 1: See CH Precision's Manufacturer's Comment.
Fig.1 CH Precision D1.5, impulse response (one sample at 0dBFS, 44.1kHz sampling, 4ms time window).
With 16-bit white noise at –4dBFS (fig.2, red and magenta traces), the D1.5's response was flat up to 14kHz but then rolled off sharply, reaching full stop-band suppression at 21kHz, which is lower than the Nyquist frequency of 22.05kHz (green vertical line). The top audio-octave rolloff meant that a full-scale tone at 19.1kHz (blue and cyan traces) was reproduced at –36dB. An aliased image at 25kHz of this tone is present but lies at just –104dB (0.0006%). More significantly, the noisefloor above 20kHz is suppressed by 25dB compared with frequencies below 16kHz.
Fig.2 CH Precision D1.5, wideband spectrum of white noise at –4dBFS (left channel red, right magenta) and 19.1kHz tone at 0dBFS (left blue, right cyan), with data sampled at 44.1kHz (20dB/vertical div.).
I examined the D1.5's frequency response in more detail, using spot frequency tones. Playing the test SACD (fig.3, magenta and red traces), the D1.5's output extended to 40kHz, above which it rolled off rapidly. With CD playback (cyan and blue traces), the response was flat to 12.5kHz but then was down by 1.1dB at 15kHz, by 3.9dB at 16kHz, and by almost 10dB at 17kHz. With the ear's reduced sensitivity in the top audio octave, the premature rolloff will be difficult to hear, but it does suggest an error in the programming of the digital reconstruction filter.
Fig.3 CH Precision D1.5, frequency response into 100k ohms with CD data at –12dBFS (left channel cyan, blue) and with SACD data at –3dBFS (left magenta, right red) (1dB/vertical div.).
Channel separation (not shown) was okay, at 63dB in both directions from 20Hz to 20kHz. The low-frequency noisefloor, examined with a 1kHz tone at 0dBFS on the test SACD, was clean (fig.4), with no power supply–related spuriae present. This graph was taken with the internal supply. Repeating the analysis with the external supply gave an identical spectrum.
Fig.4 CH Precision D1.5, spectrum of 1kHz sinewave, DC–1kHz, at 0dBFS (left channel blue, right red; linear frequency scale).
Fig.5 CH Precision D1.5, spectrum with noise and spuriae of dithered 1kHz tone at –90dBFS with CD data (left channel cyan, right blue) and of dithered 1kHz tone at –60dBFS with SACD data (left magenta, right red) (20dB/vertical div.).
Fig.6 CH Precision D1.5, waveform of undithered 16-bit, 1kHz sinewave at –90.31dBFS (left channel blue, right red).
Fig.7 CH Precision D1.5, spectrum of 100Hz sinewave, SACD data, at 0dBFS, DC–1kHz, into 100k ohms (left channel blue, right red; linear frequency scale).
Fig.8 CH Precision D1.5, HF intermodulation spectrum (DC–30kHz), 19+20kHz, CD data, at 0dBFS into 100k ohms (left channel blue, right red; linear frequency scale).
Fig.9 CH Precision D1.5, high-resolution jitter spectrum of analog output signal, 11.025kHz at –6dBFS, sampled at 44.1kHz with LSB toggled at 229Hz: 16-bit CD data (left channel blue, right red). Center frequency of trace, 11.025kHz; frequency range, ±3.5kHz.
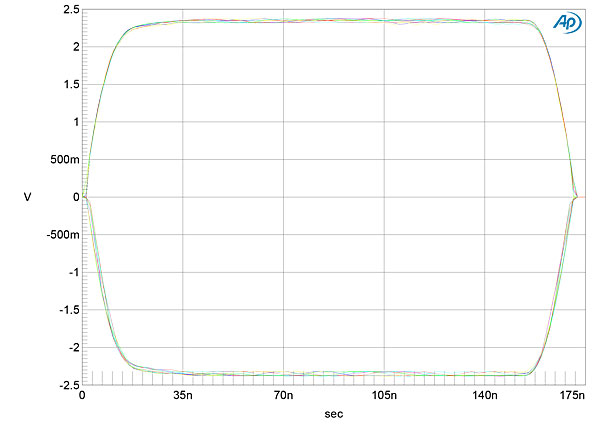
As the CH Precision D1.5 has digital outputs, to allow it to be used as a transport, I examined the quality of those outputs. Fig.10 was taken from the TosLink output with 16-bit J-Test data plotted over one "unit cycle." The eye pattern is wide open, with almost no blurring of the leading and trailing edges. The average jitter level, assessed with a 50Hz–100kHz bandwidth, was very low, at 340.5ps. Repeating the test with the coaxial S/PDIF output gave an identical eye pattern but with just 253.9ps of jitter. Turning on 2× upsampling gave a similarly wide-open eye pattern (though half the length of that shown in fig.10), with 340.5ps of jitter.
Fig.10 CH Precision D1.5, eye pattern of TosLink data output carrying 16-bit, 44.1kHz J-Test data (±2.5V vertical scale, 175ns horizontal scale).
The CH Precision D1.5 offers generally excellent measured performance. It performed well as a transport and with SACD playback, but I remain puzzled by its premature high-frequency rolloff with CD playback (footnote 1).—John Atkinson
Footnote 1: See CH Precision's Manufacturer's Comment.


