Sidebar 3: Measurements
I performed a complete set of measurements on one of the Accuphase A-300s (serial number L2Y188) in its Normal mode with my Audio Precision SYS2722 system. I preconditioned the A-300 by following the CEA's recommendation of running it at one-eighth the specified power into 8 ohms for 30 minutes. At the end of that time, the temperature of the top panel was 97.6°F (36.4°C) and that of the side-mounted heatsinks 120.4°F (49.1°C).
As auditioned by JVS, the balanced input was wired with pin 2 negative, the opposite of the AES standard. (A rear-panel switch allows it to be changed to pin 2 positive.) In the default position, therefore, the Accuphase's balanced input inverted absolute polarity, though this is easily changed. The single-ended Line input was noninverting. The A-300's balanced input impedance is specified as 40k ohms. I measured 39.6k ohms at 20Hz and 1kHz, 14.8k ohms at 20kHz. The single-ended input impedance, specified as 20k ohms, was 19.3k ohms at 20Hz and 1kHz but 5k ohms at 20kHz. With the gain set to MAX, the voltage gain at 1kHz into 8 ohms with both input types was close to the specified 28dB, at 27.83dB. The three lower gain settings lowered the voltage gain by 3dB, 6dB, and 12dB, respectively.
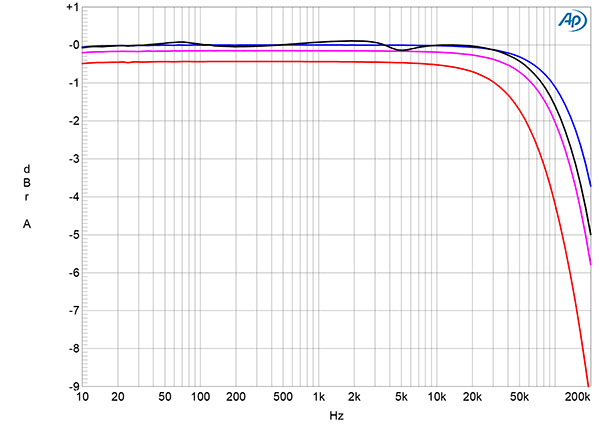
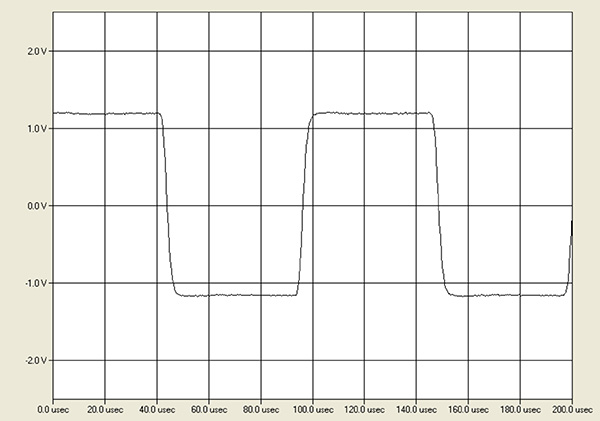
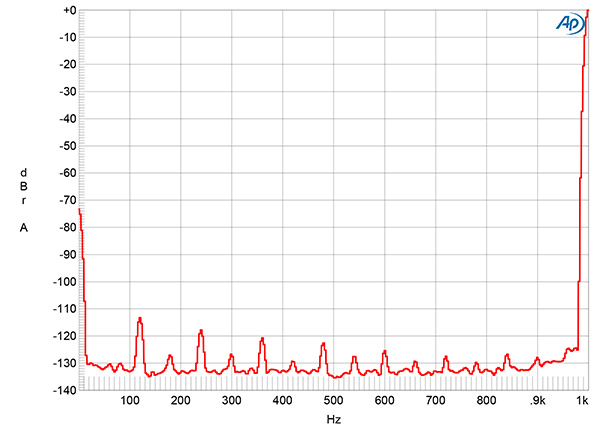
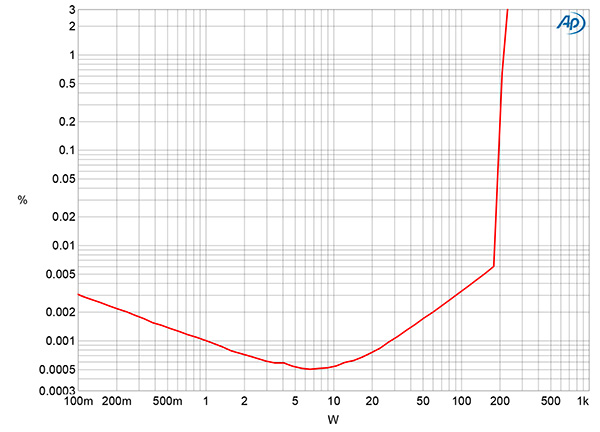
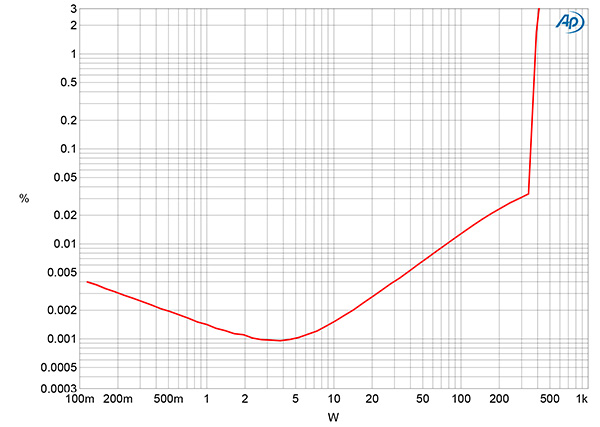
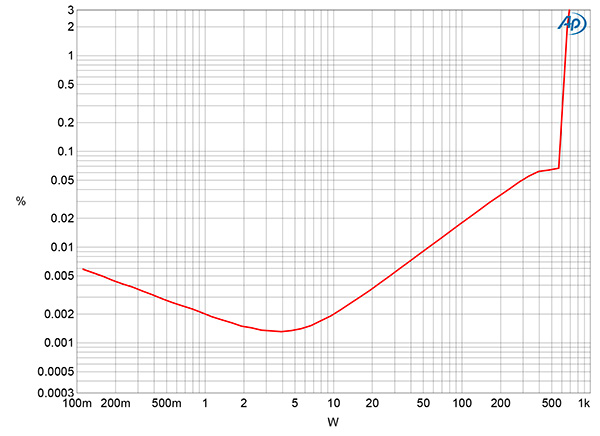
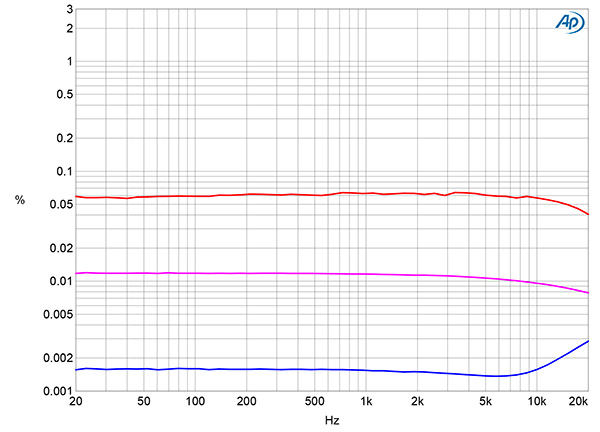
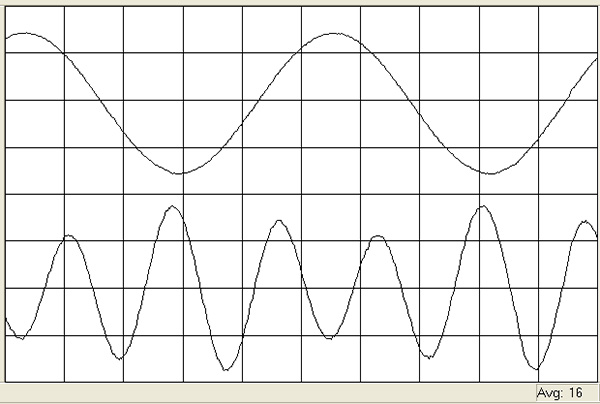
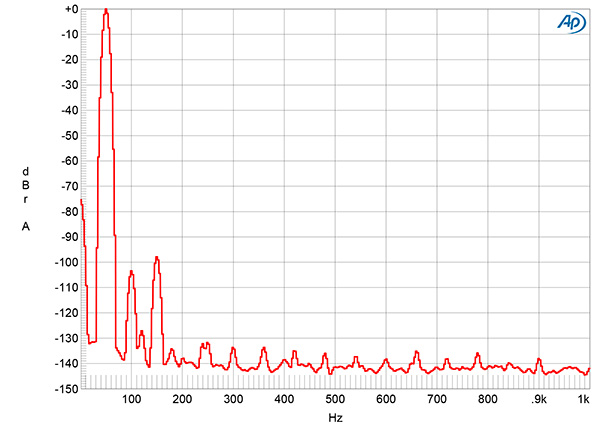
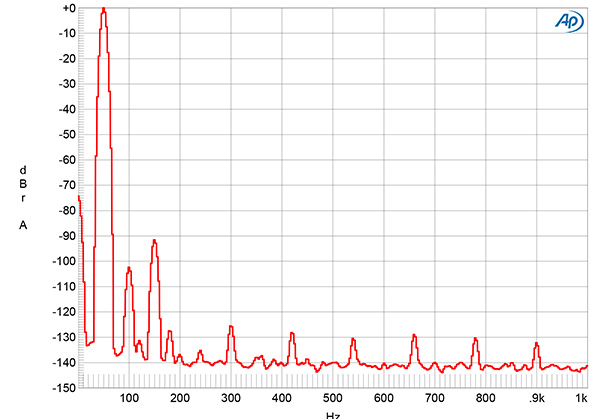
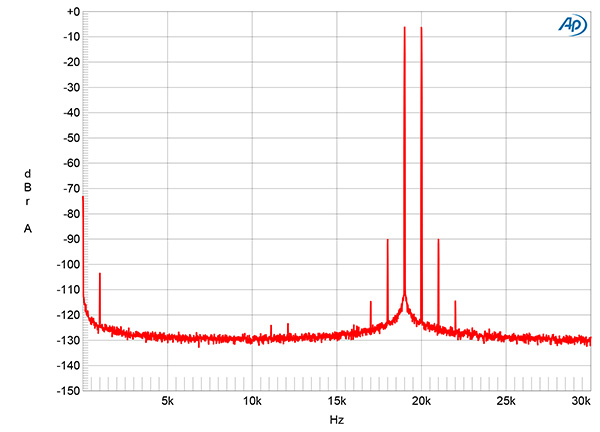
Fig.1 Accuphase A-300, frequency response at 2.83V into: simulated loudspeaker load (gray), 8 ohms (blue), 4 ohms (magenta), and 2 ohms (red) (1dB/vertical div.).
Fig.2 Accuphase A-300, small-signal 10kHz squarewave into 8 ohms.
The output impedance, including the series impedance of 6' of spaced-pair cable, was a relatively low 0.14 ohms at 20Hz and 1kHz, 0.18 ohms at 20kHz. As a result, the variation in the frequency response with our standard simulated loudspeaker (fig.1, gray trace) was minimal, at ±0.15dB. The response into resistive loads was flat in the audioband, not reaching –3dB until 180kHz into 8 ohms (blue) and 130kHz into 4 ohms (magenta). With its wide small-signal bandwidth, the Accuphase's reproduction of a 10kHz squarewave into 8 ohms featured with very short risetimes in both modes (fig.2), with no overshoot or ringing.
Fig.3 Accuphase A-300, spectrum of 1kHz sinewave, DC–1kHz, at 1W into 8 ohms (linear frequency scale).
The unweighted, wideband signal/noise ratio (ref. 1W into 8 ohms), taken with the single-ended input shorted to ground and the gain set to MAX, was a superb 88.9dB. This ratio improved to 103.6dB when the measurement bandwidth was restricted to 22Hz–22kHz and to 106.3dB when A-weighted. The ratios were 2–3dB greater with the gain to set to –12dB. Spectral analysis of the low-frequency noisefloor while the Accuphase drove a 1kHz tone at 1W into 8 ohms revealed a low random noisefloor, and while even-order harmonics of 60Hz were present, these all lay at or below –114dB (fig.3).
Fig.4 Accuphase A-300, distortion (%) vs 1kHz continuous output power into 8 ohms.
Fig.5 Accuphase A-300, distortion (%) vs 1kHz continuous output power into 4 ohms.
Fig.6 Accuphase A-300, distortion (%) vs 1kHz continuous output power into 2 ohms.
Accuphase specifies the A-300's maximum power in Normal mode as 125W into 8 ohms, 250W into 4 ohms, 500W into 2 ohms, and 1000W into 1 ohm, all of which are equivalent to 21dBW. We define an amplifier's clipping power as being when the THD+noise reaches 1%. With that criterion, the A-300 exceeded its specified powers. I measured 210W into 8 ohms (23.2dBW, fig.4), 385W into 4 ohms (22.8dBW, fig.5), and 610W into 2 ohms (21.8dBW, fig.6). I didn't examine the clipping power into 1 ohm, as I don't have a high-power test load with that value.
Fig.7 Accuphase A-300, THD+N (%) vs frequency at 20V into: 8 ohms (blue), 4 ohms (magenta), and 2 ohms (gray).
I examined how the percentage of THD+N varied with frequency at 20V, equivalent to 50W into 8 ohms, 100W into 4 ohms, and 200W into 2 ohms (fig.7). The THD+N percentage was extremely low into 8 ohms (blue trace) but rose into 4 ohms (magenta trace) and 2 ohms (red trace). It was still low in absolute terms, however.
Fig.8 Accuphase A-300, 1kHz waveform at 60W into 4 ohms, 0.009% THD+N (top); distortion and noise waveform with fundamental notched out (bottom, not to scale).
Fig.9 Accuphase A-300, spectrum of 50Hz sinewave, DC–1kHz, at 30W into 8 ohms (linear frequency scale).
Fig.10 Accuphase A-300, spectrum of 50Hz sinewave, DC–1kHz, at 75W into 8 ohms (linear frequency scale).
The distortion waveform was predominantly the third harmonic (fig.8), though the second harmonic was present at a lower level (fig.9). Commendably, higher-order harmonics were absent. This graph was taken at 30W into 8 ohms, which is below the power where the Accuphase's output stage transitions from class-A to class-AB. Performing the spectral analysis at 75W into 8 ohms, which is closer to the transition power, the third harmonic rose by 8dB (fig.10) compared with fig.9 but was still very low at –99dB (0.001%). With the amplifier driving 60W into 4 ohms (not shown), the third harmonic lay at –80dB (0.01%), the second at –93dB (0.002%).
Fig.11 Accuphase A-300, HF intermodulation spectrum, DC–30kHz, 19+20kHz at 60W peak into 4 ohms (linear frequency scale).
Intermodulation distortion with an equal mix of 19 and 20kHz tones was also very low in level, even above the transition power at 4 ohms (fig.11).
The Accuphase A-300's measured performance indicates that it has no problem driving low impedances, and it offers very low distortion, especially into 8 ohms. It is also a very quiet amplifier, even at the highest gain setting.—John Atkinson


