The ST70 Series II, like most tube amplifiers, ran quite warm after its preconditioning test and in normal operation. It was noninverting, and though the measured DC offset was generally below 10mV, it was also unstable, as it was with the Nobis. The unweighted wide-band S/N ratio of the ST70 II measured 60dB, referenced to 1W into 8 ohms.
The input impedance of the ST70 II was quite high—over 330k ohms—which is typical of many tube amplifiers. Matching to the output of any reasonably designed preamplifier should present no problem. Its output impedance from the 8 ohm tap was 0.7 ohm from 20Hz to 1kHz, falling to 0.46 ohm at 20kHz. From the 4 ohm tap, these values were reduced to 0.5 ohm from 20Hz to 1kHz, falling at 20kHz to 0.4 ohm. Using the 16 ohm tap, the output impedance rose to about 1.37 ohms between 20Hz and 1kHz, and dropped to 0.99 ohm at 20kHz, with some load dependence noticeable.
The small-signal frequency response of the ST70 II—1W into 8 ohms from the 8 ohm tap—is shown in fig.1. (The response was essentially the same from the other output taps). With the response 2dB down at 20kHz, there is likely to be an obvious softening of a system's sound with the ST70 II. The 10kHz squarewave response of the ST70 II with a 100mV input is shown in fig.2, with the rounded leading edges of the waveshape typical of a higher-frequency rolloff.

Fig.1 Dynaco Stereo 70 II, 8 ohm tap, frequency response at 1W into 8 ohms (0.5dB/vertical div., right channel dashed).
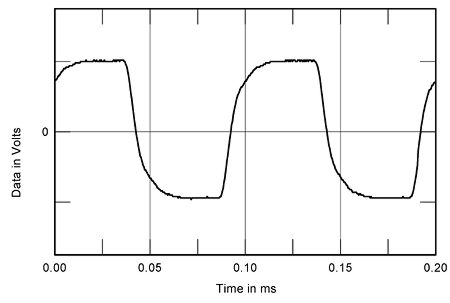
Fig.2 Dynaco Stereo 70 II, small-signal 10kHz squarewave into 8 ohms.
The THD+noise vs frequency response of the ST70 II at the same output voltage—2.828V—into 8, 4, and 2 ohms, is shown in figs.3 (4 ohm tap), 4 (8 ohm tap), and 5 (16 ohm tap). (The 4W output into 2 ohm measurements were taken for one channel only.) Note that the lowest distortion, at least at these output levels, results from the use of the 4 ohm tap, though the differences into 4 or 8 ohm loads between this and the 8 ohm tap are not dramatic. The higher current output demanded by the 2 ohm load results in noticeably higher distortion, particularly as the impedance of the output tap increases.
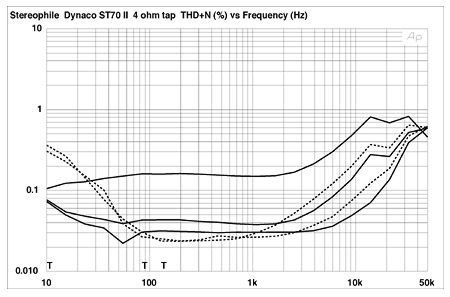
Fig.3 Dynaco Stereo 70 II, 4 ohm tap, THD+noise (%) vs frequency at (from bottom to top): 1W into 8 ohms; 2W into 4 ohms; 4W into 2 ohms (right channel dashed).

Fig.4 Dynaco Stereo 70 II, 8 ohm tap, THD+noise (%) vs frequency at (from bottom to top): 1W into 8 ohms; 2W into 4 ohms; 4W into 2 ohms (right channel dashed).
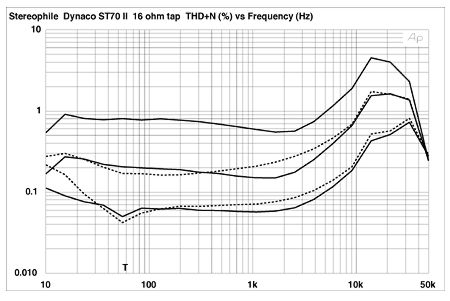
Fig.5 Dynaco Stereo 70 II, 16 ohm tap, THD+noise (%) vs frequency at (from bottom to top): 1W into 8 ohms; 2W into 4 ohms; 4W into 2 ohms (right channel dashed).
The THD+noise vs level for the ST70 II at 1kHz is shown in figs.6 and 7, for the 4 ohm and 8 ohm output taps, respectively. Note that the maximum power output is obtained when the tap corresponding to the load impedance is used. Also note the higher distortion and/or lower power output into the 2 ohm load. The corresponding result for the 16 ohm output taps is not shown, but this tap delivers approximately 6W into a 2 ohm load, 17W into a 4 ohm load, and 30W into an 8 ohm load (at the 1% THD+noise level).
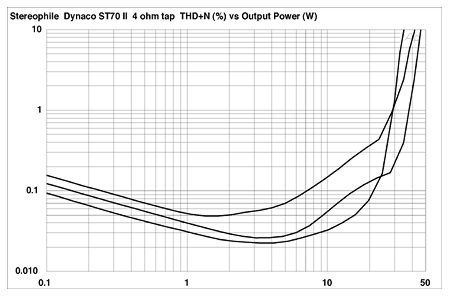
Fig.6 Dynaco Stereo 70 II, 4 ohm tap, distortion (%) vs continuous output power into (from bottom to top at 10W): 8 ohms, 4 ohms, and 2 ohms.
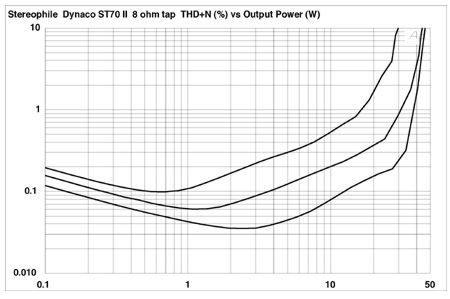
Fig.7 Dynaco Stereo 70 II, 8 ohm tap, distortion (%) vs continuous output power into (from bottom to top at 10W): 8 ohms, 4 ohms, and 2 ohms.
The 16 ohm taps are probably best avoided except for that rare loudspeaker with a nominal 16 ohm impedance. As a matter of possible interest to those who might own such loudspeakers, I measured the 1% THD+noise level of the ST70 II at 1kHz, driving a 16 ohm load from the 16 ohm tap (one channel driven), to be just over 41W.
The 1% distortion point for an 8 ohm load driven from the 8 ohm tap measured 34.05W (15.32dBW, left channel, both driven), 35.6W (15.5dBW, right channel, both driven), and 36.7W (15.65dBW, one channel driven). For a 4 ohm load driven from the 4 ohm tap, the corresponding figures were 34.08W (12.3dBW, left channel, both driven), 36.4W (12.6dBW, right channel, both driven), and 37.45W (12.7dBW, one channel driven). The line voltages during these measurements varied from 112.5 to 114.5V.
The results from feeding a 50Hz signal into the ST70 II (4 ohm load, 4 ohm tap, 22.5W output) are shown in fig.8. Table 1 shows the harmonics (up to the sixth), the number of dB down the harmonics are from the 50Hz fundamental (to the nearest dB), followed (in parenthesis) by the approximate distortion level this represents. The noise artifacts visible at other frequencies, including those caused by line noise, are not shown in the table.

Fig.8 Dynaco Stereo 70 II, spectrum of 50Hz sinewave, DC-1kHz, at 22.5W into 4 ohms (linear frequency scale).
Table 1
| Frequency Hz | dB down | (%) |
| 100 | -64 | (0.06%) |
| 150 | -64 | (0.06%) |
| 200 | -77 | (0.015%) |
| 250 | -92 | (0.0025%) |
| 300 | -87 | (0.0045%) |
| 350 | -81 | (0.009%) |
The harmonics drop off in level with increasing frequency, and are generally lower in level than those found in the Nobis, though the audible significance of the differences is not certain, as the actual distortion percentages for both amplifiers are relatively low. The same comments apply to fig.9, which shows the IM distortion resulting from a combined 19+20kHz signal (16.3W output into a 4 ohm load from the 4 ohm tap). The levels of the artifacts below the fundamentals are shown in Table 2, with the approximate distortion level this represents in parentheses. Distortion is, again, low through the audible range.
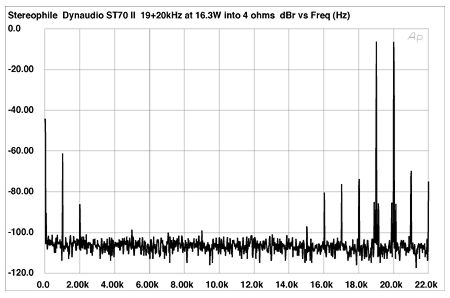
Fig.9 Dynaco Stereo 70 II, HF intermodulation spectrum, DC-22kHz, 19+20kHz at 16.3W into 4 ohms (linear frequency scale).
Table 2
| Frequency kHz | dB down | (%) |
| 21 | -63 | (0.07%) |
| 18 | -67 | (0.045%) |
| 17 | -70 | (0.03%) |
| 16 | -74 | (0.02%) |
| 15 | -91 | (0.003%) |
| 14 | -96 | (0.0015%) |
| 13 | -95 | (0.002%) |
| 12 | -96 | (0.0015%) |
| 10 | -96 | (0.0015%) |
| 6 | -97 | (0.0015%) |
| 5 | -92 | (0.0025%) |
| 4 | -98 | (0.0012%) |
| 3 | -97 | (0.0013%) |
| 2 | -80 | (0.01%) |
| 1 | -55 | (0.2%) |
Finally, the crosstalk performance of the ST70 II is shown in fig.10. The typical increase in the upper octaves, usually caused by capacitive coupling between channels, is seen here. The flattening out of the curves below 1kHz is due to the crosstalk dropping below the amplifier's noise floor. Note the peak at the third harmonic of the power supply, 180Hz, which can also be seen in fig.8.
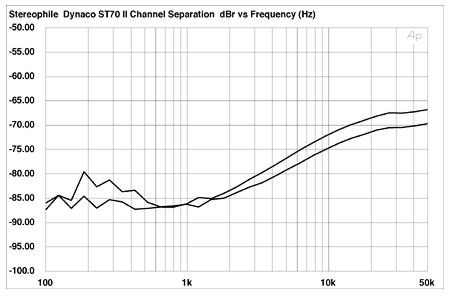
Fig.10 Dynaco Stereo 70 II, channel separation: L-R (top) and R-L (5dB/vertical div.).
Like the Nobis, the ST70 II's performance is good within its power rating. The measurements are on a par with a typical, modestly designed tube amplifier. The normal precautions about loudspeaker matching with an amplifier having a high output impedance apply, though not nearly to the same degree as with the Nobis.—Thomas J. Norton