Sidebar 3: Measurements
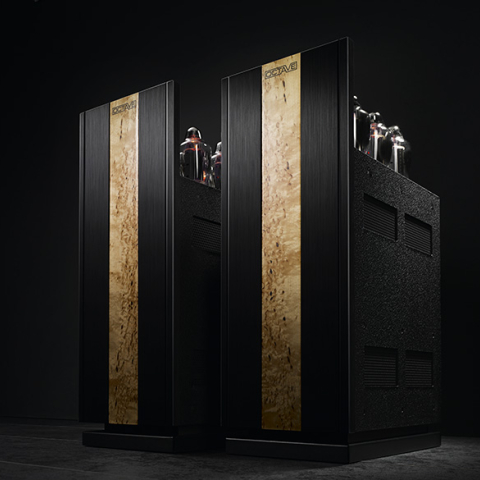
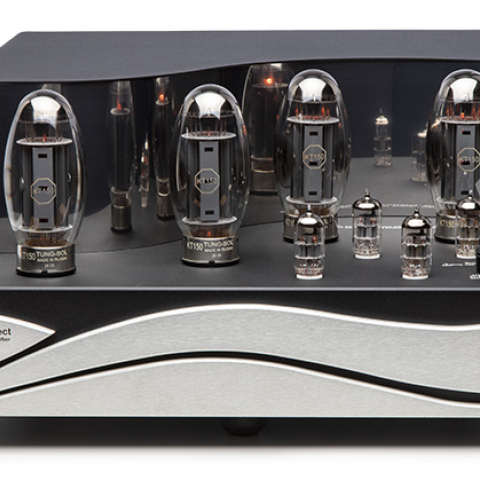
When I unpacked one of the Evolution Monoblock amplifiers (serial number EVO2027), I wondered if I had the correct amplifier, as it looked identical to the Doshi Monoblock V3.0 that JVS reviewed in November 2018. It even uses the same quartet of Tung-Sol KT150 output tubes. But as Jason describes in this review, there are significant differences.
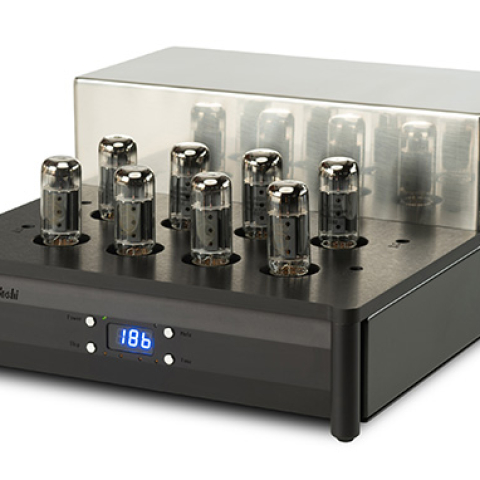
As with the older amplifier, before I started examining its performance on the test bench with my Audio Precision SYS2722 system (see the January 2008 "As We See It"), I left the amplifier powered up for 30 minutes then checked the bias current for each of the four KT150s using the front-panel display and the four trim pots on the top panel. I set all four to the recommended 190mV. The trim pots for adjusting bias are very sensitive, so it took me several attempts to achieve the exact settings.
The Evolution Monoblock has both balanced (Buffered) and single-ended (DIR.SE) inputs. Doshi recommends using the single-ended input, so I performed a full set of measurements with that input, repeating some tests with the balanced input. I measured a voltage gain of 29.0dB into 8 ohms with both inputs, and both preserved absolute polarity (ie, were noninverting). The XLR jack is wired with pin 2 hot. The input impedance is specified as 20k ohms, balanced, and 40k ohms, unbalanced. I measured 37k ohms at 20Hz and 1kHz for the single-ended inputs, this dropping inconsequentially to 34k ohms at 20kHz. The balanced input impedance was 39.2k ohms from 20Hz to 20kHz, ie, 19.6k ohms per phase.
The output impedance, specified as 0.5 ohms, was 0.54 ohms at 20Hz and 1kHz, rising to 0.67 ohms at 20kHz. As a result, the modulation of the Doshi's frequency response driving our standard simulated loudspeaker was a moderate ±0.35dB (fig.1, gray trace). The small-signal bandwidth was extraordinarily wide, extending at full level down to 10Hz and up to 80kHz into 8 ohms (blue trace). The ultrasonic rolloff began a little earlier into lower impedances, the response into 2 ohms (red trace) being –0.5dB at 20kHz. The 1kHz squarewave was superbly square (not shown), but the damped peak just above 100kHz in the frequency response traces correlates with critically damped ringing on the tops and bottoms of a 10kHz squarewave (fig.2).
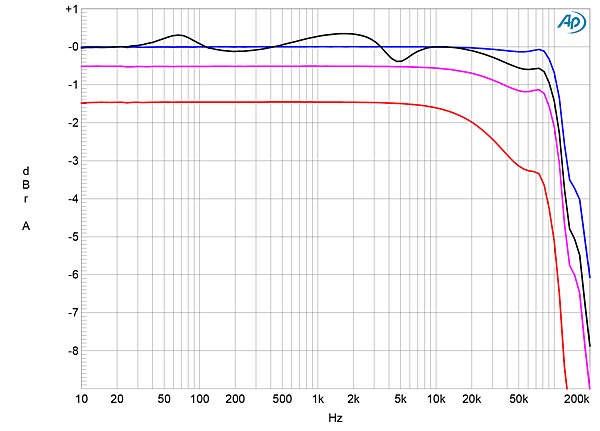
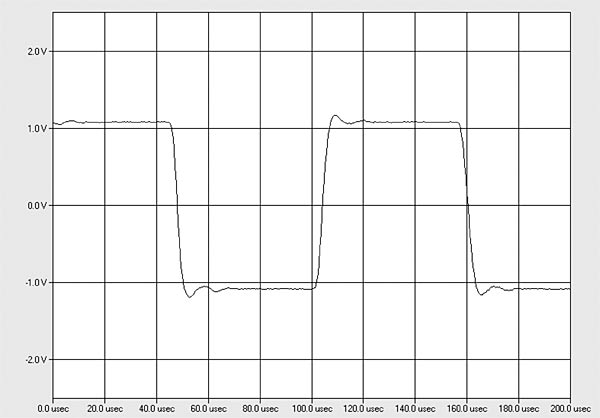
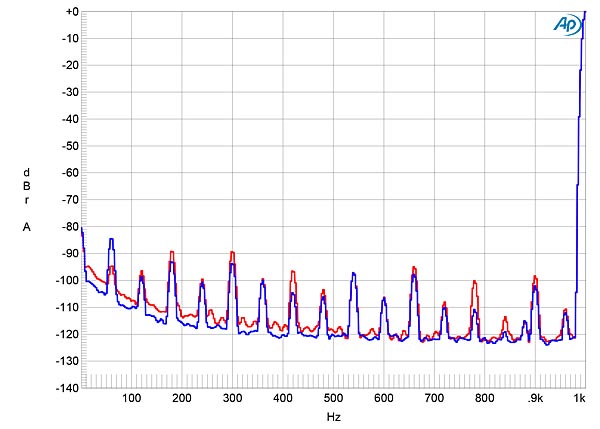
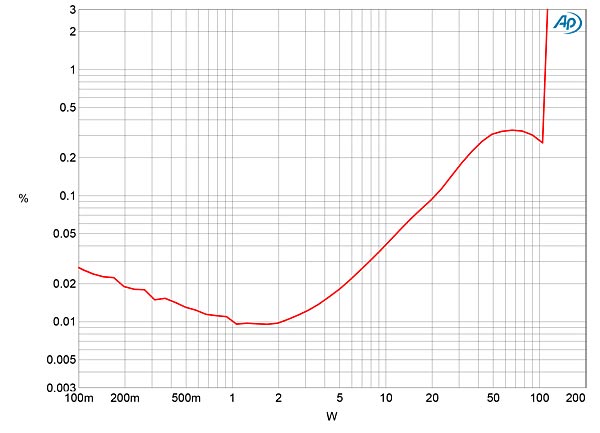
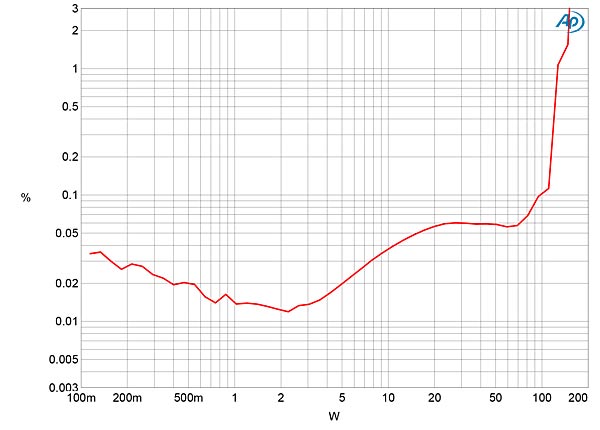
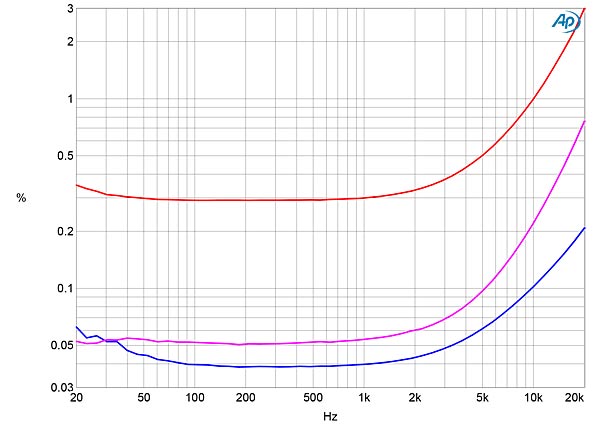
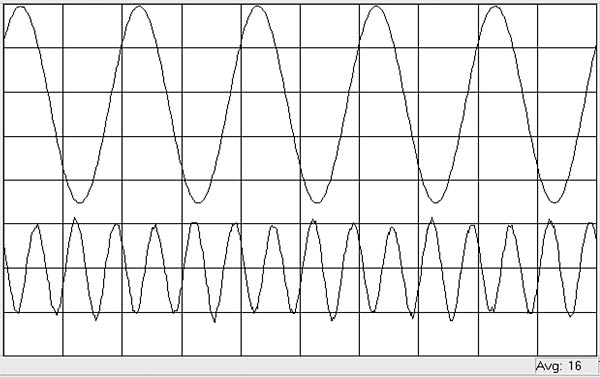
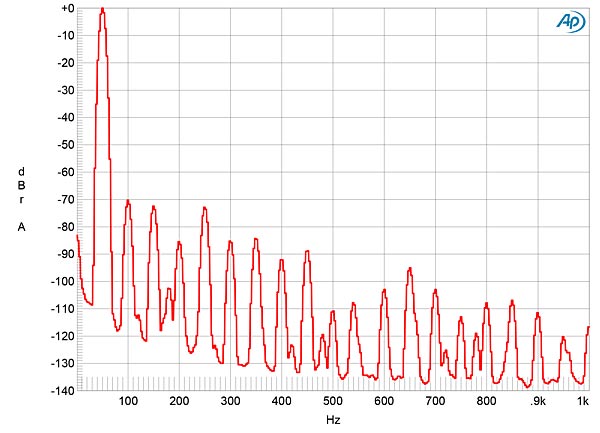
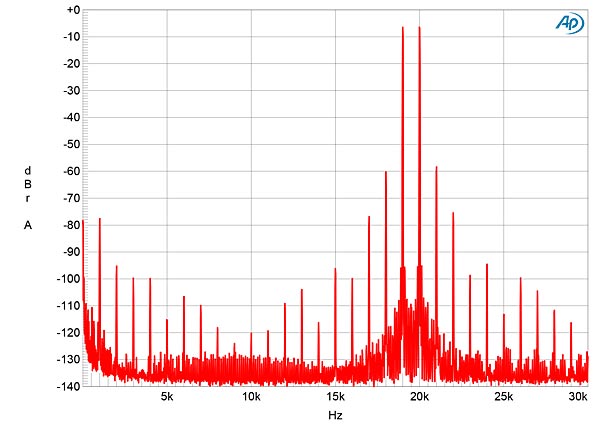
Fig.1 Doshi Evolution Monoblock, frequency response at 2.83V into: simulated loudspeaker load (gray), 8 ohms (blue), 4 ohms (magenta), 2 ohms (red) (1dB/vertical div.).
Fig.2 Doshi Evolution Monoblock, small-signal, 10kHz squarewave into 8 ohms.
The new amplifier was significantly quieter than the old one. The unweighted, wideband signal/noise ratio, taken with the single-ended inputs shorted to ground, was 80.1dB ref. 1W into 8 ohms compared with 64dB. This ratio was not affected by the rear-panel ground-lift switch but improved to 85.6dB when I restricted the measurement to the audioband and to 91.6dB with an A-weighting filter in circuit. Spectral analysis of the low-frequency noise floor (fig.3) revealed low-level AC-supply–related harmonics at 60Hz and its harmonics, which were lower with the amplifier's rear-panel ground switch set to Lift (blue trace) than to Ground (red trace). But even without the ground lifted, these supply harmonics are all 20dB lower in level than the V3.0's.
Fig.3 Doshi Evolution Monoblock, spectrum of 1kHz sinewave, DC–1kHz, at 1W into 8 ohms with ground lifted (blue) and connected (red) (linear frequency scale).
The Evolution Monoblock's maximum power is specified at 160W into 4 ohms (19.0dBW ref. 1W into 8 ohms). With clipping defined as when the THD+noise in the output reaches 1%, the Doshi's clipping power was 107W into 8 ohms (20.4dBW, fig.4) and 127W into 4 ohms (18.0dBW, fig.5). Relaxing the clipping criterion to 3% THD+N increased the maximum power into 4 ohms to 153W (18.9dBW), a shortfall compared with the specified power of just 0.1dB. (The AC power line was 118.5V with the amplifier clipping into 4 ohms.) Less power was available into 2 ohms—93W (13.8dBW)—but the Doshi Evolution amplifier would still have had no difficulty driving JVS's current-hungry Wilson speakers.
Fig.4 Doshi Evolution Monoblock, distortion (%) vs 1kHz continuous output power into 8 ohms.
Fig.5 Doshi Evolution Monoblock, distortion (%) vs 1kHz continuous output power into 4 ohms.
What I found interesting about figs.4 and 5 is that at powers above 25W, the Evolution Monoblock has lower distortion into 4 ohms than it does into 8 ohms. I examined how the Doshi's THD+N varied with frequency at 8.95V (equivalent to 10W into 8 ohms, 20W into 4 ohms, and 40W into 2 ohms), and at this level the lowest distortion was with 8 ohms (fig.6, blue trace). The THD+N was still very low into 4 ohms (magenta trace), but rose into 2 ohms (red trace) and in the top two audio octaves. As with the older amplifier, the distortion doesn't rise at low frequencies—a tribute to the output transformer's core being sufficiently massive (and heavy) not to become saturated.
Fig.6 Doshi Evolution Monoblock, THD+N (%) vs frequency at 8.95V into: 8 ohms (blue), 4 ohms (magenta), 2 ohms (red).
The Doshi amplifier's distortion signature at moderate powers into 4 ohms was almost pure third harmonic (fig.7), a characteristic it shared with the V3.0. However, the second harmonic rose in level at higher powers into 4 ohms (fig.8), and higher-order harmonics made an appearance. With an equal mix of 19 and 20kHz tones and the signal peaking at 60W into 4 ohms (fig.9), the decrease in the circuit's linearity at very high frequencies resulted in some higher-order products, the highest in level of which, at 21kHz and 18kHz, each lay at –60dB (0.1%). However, the difference product at 1kHz was lower in level than with the older amplifier, at –79dB (0.01%) compared with –71dB (0.03%).
Fig.7 Doshi Evolution Monoblock, 1kHz waveform at 10W into 4 ohms, 0.089% THD+N (top); distortion and noise waveform with fundamental notched out (bottom, not to scale).
Fig.8 Doshi Evolution Monoblock, spectrum of 50Hz sinewave, DC–1kHz, at 60W into 4 ohms (linear frequency scale).
Fig.9 Doshi Evolution Monoblock, HF intermodulation spectrum, DC–30kHz, 19+20kHz at 60W peak into 4 ohms (linear frequency scale).
As with Doshi's Monoblock V3.0 amplifier, the Evolution Monoblock power amplifier's measured performance indicates conservative audio engineering, a superb output transformer, and the ability to deliver high powers into relatively low impedances.—John Atkinson