Because the Cary CAD-805, like any tube amplifier, has multiple output taps (further complicated in the case of the 805 by the presence of a choice of feedback settings), I chose to perform a cross-section of diagnostic tests. Most of the measurements were made with 5dB of feedback—the setting chosen by Dick Olsher for most of his listening evaluations—with selected additional measurements presented at 0dB and 10dB of feedback. In the case of the latter two, the 8 ohm tap was used with an 8 ohm load. Also, only a few select measurements were made into a 16 ohm load—a load that a search of the October 1993 Audio equipment directory shows to be very rare among modern loudspeakers. If it's not otherwise stated in the discussion below, the measurements should be assumed to be from the 8 ohm tap with 5dB of feedback.
Following its 1-hour, 1/3-power preconditioning test, the Cary CAD-805 was no hotter than you might expect in normal operation. (This test was devised by the IHF primarily with solid-state class-B amplifiers in mind—in which case 1/3 power roughly corresponds to a worst-case heating situation. It is less applicable to tube amplifiers, but we perform it in the latter case primarily to maintain consistency and to warm-up and stabilize the amplifier.) Voltage gain averaged 23.2dB at 5dB feedback (into an 8 ohm load, slightly less into a 4 ohm load, slightly more into a 16 ohm load). With 0dB of feedback, the gain increased to 25.2dB; with 10dB of feedback it dropped to 18.2dB (all into an 8 ohm load). The input impedance measured just under 104k ohms, DC offset 0.1mV (largely noise). The CAD-805 was non-inverting, a positive-going input emerging positive at the output. The wideband S/N ratio, unweighted (at 1W into 8 ohms), was an excellent 108.1dB.
The CAD-805's output impedance is shown in Table 1 for several different conditions of operation. (The figures shown are averages; there was a small variation of the calculated value with load impedance, but this was not particularly significant.) The values are reasonably low for a tube amplifier, and while some sensitivity to loudspeaker load may be expected—the higher the output impedance of an amplifier, the more such sensitivity increases—I would expect it to be less here than with many tube amps having higher output impedances (see my "Questions of Impedance Interaction" article).
Table 1: Output Impedance
| Output Tap | Feedback | Ohms | ||
| Ohms | dB | 20Hz | 1kHz | 20kHz |
| 4 | 5 | 0.51 | 0.63 | 0.62 |
| 8 | 5 | 0.74 | 0.92 | 0.86 |
| 16 | 5 | 1.14 | 1.38 | 1.14 |
| 8 | 0 | - | 1.18 | 1.14 |
| 8 | 10 | - | 0.49 | - |
Fig.1 shows the frequency response with 5dB of negative feedback at the 8 ohm tap (the scale here is expanded to ±3dB instead of our usual ±2dB). The two topmost curves—the response at 1W into 8 ohms and 2W into 4 ohms, respectively—are virtually the same, with the exception of there being less output into 4 ohms at 10Hz. The lower curve shows the response at 1W into 8 ohms from the 4 ohm tap (the response at 2W into 4 ohms from the 4 ohm tap is virtually identical except that it's -1dB at 10Hz). Note that all the responses show a rise in the high frequencies peaking out just under 30kHz and a dip in the bass centered just above 20Hz. The former—probably due to the output transformer—may be audible in some circumstances since the rise begins in the audible range. The low-frequency dip, however, probably will be audible on a system having good low-end extension.
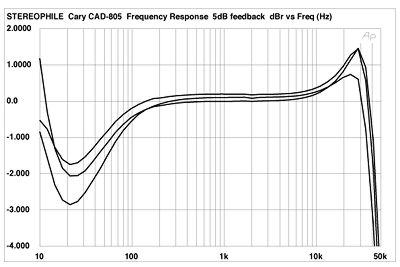
Fig.1 Cary CAD-805, 5dB negative feedback, frequency response at (from top to bottom at 30kHz): 1W into 8 ohms (8 ohm tap), 2W into 4 ohms (8 ohms tap), 1W into 8 ohms (4 ohm tap) (1dB/vertical div.).
Fig.2 shows the frequency response again, this time as the negative feedback is varied. Here, increasing the feedback reduces the bass dip, decreasing feedback aggravates it. At the top end, increasing feedback increases the magnitude of the peak but pushes it slightly higher in frequency. The results from the 16 ohm tap are not shown; they are similar from 100Hz to 20kHz, but with a greater rise above 20kHz and a lesser dip below 100Hz.
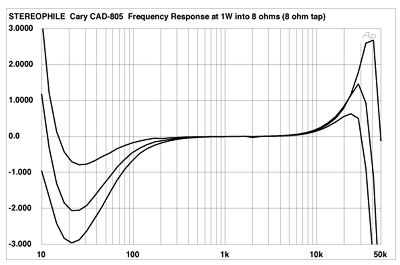
Fig.2 Cary CAD-805, frequency response at 1W into 8 ohms (8 ohm tap) with (from top to bottom at 30kHz): 10dB, 5dB, and 0dB negative feedback (1dB/vertical div.).
The CAD-805's output, in response to a 1kHz squarewave, is shown in fig.3. Note the small leading-edge overshoot (which actually becomes slightly more pronounced as the feedback is increased to 10dB—not shown). At 10kHz (fig.4) the overshoot and damped oscillations are more apparent—reflecting the ultrasonic peak in the amplitude response.
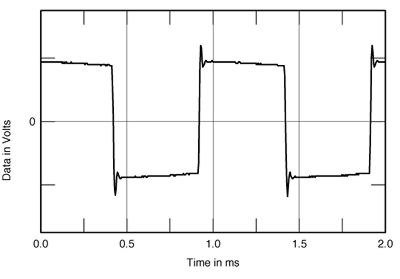
Fig.3 Cary CAD-805, 1kHz squarewave at 1W into 8 ohms (8 ohm tap).
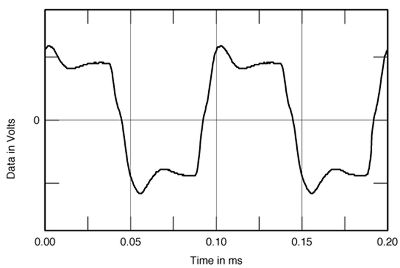
Fig.4 Cary CAD-805, 10kHz squarewave at 1W into 8 ohms (8 ohm tap).
Fig.5 shows the THD+noise at 1W into 8 ohms from all three taps; fig.6 shows the same, except at 2W into 4 ohms. Note that in both cases the 4 ohm tap gives the lowest distortion through the midband, though it crosses over to become marginally the highest at 20kHz. Though you might conclude from this that the 4 ohm tap is optimum for either 4 or 8 ohm loads, you would be wrong in the case of an 8 ohm load—as the THD+noise vs level curves, presented below, will confirm. The levels here are moderately high, though not unexpectedly so for a single-ended, low-feedback design. The THD+noise vs frequency curves for a 2 ohm load (4W) are not shown; they show a reading of under 0.7% from 100Hz to 3kHz from the 4 ohm tap, remaining below 1.3% at 10Hz but rising to just under 2.5% at 20kHz. From the 8 ohm and 16 ohm taps, the midband THD+noise rises to just over 1% and 2% respectively for 4W into 2 ohms. These results, together with the THD+noise figures below, indicate that DO was correct to restrict his search for a loudspeaker to use with the CAD-805 to those whose load impedance remains both high and relatively uniform.
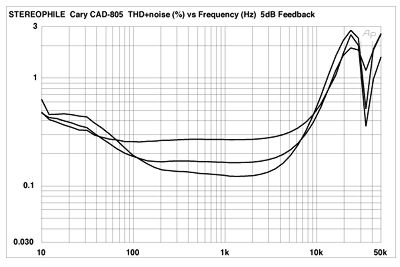
Fig.5 Cary CAD-805, THD+noise vs frequency at 1W into 8 ohms, 5dB feedback, from (from top to bottom at 35kHz): 8 ohm tap, 4 ohm tap, 16 ohm tap.
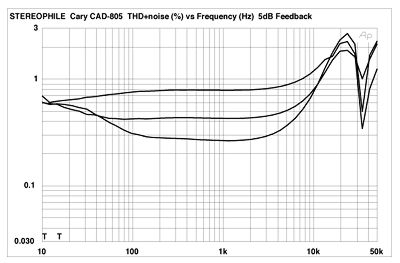
Fig.6 Cary CAD-805, THD+noise vs frequency at 2W into 4 ohms, 5dB feedback, from (from top to bottom at 35kHz): 4 ohm tap, 16 ohm tap, 8 ohm tap.
Fig.7 shows how the low-level THD+noise vs frequency changes with varying levels of feedback. As expected, the change tracks the amount of feedback—higher THD+noise with less feedback—but the differences with the small amount of feedback used here are not dramatic.
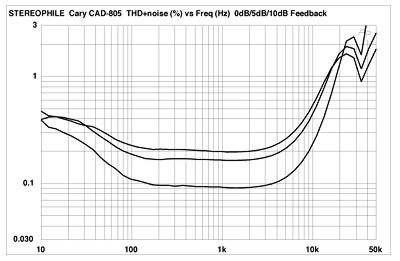
Fig.7 Cary CAD-805, THD+noise vs frequency at 1W into 8 ohms, 8 ohm tap, with (from top to bottom at 35kHz): 10dB, 5dB, and 0dB feedback.
The 1kHz THD+noise waveform at low power into both 8 ohms and 4 ohms, not shown, is almost pure second harmonic with some noise. Fig.8 shows the THD+noise waveform for 4W into 2 ohms (from the 4 ohm tap). The result is still heavily second-harmonic, though with an interesting notch on the downside of every other cycle in the distortion wave. This corresponds to the negative-going portion of the signal itself and may relate to the circuit's intrinsic performance, possibly the single-ended output tube in this circumstance. The THD+noise here is actually fairly low in level: under 0.3% (see fig.6). Though the CAD-805's THD+noise levels are higher than those usually seen with competitive high-end amplifiers, their heavily second-harmonic nature should be musically consonant with the input. [The individual distortion harmonic tracks on Stereophile's Test CD 2 show quite convincingly that even 1% of second harmonic is completely inaudible.—Ed.]
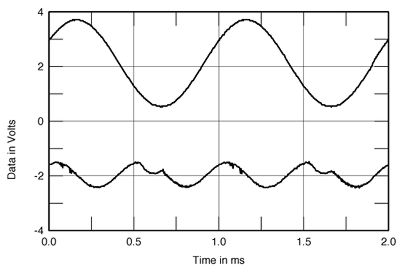
Fig.8 Cary CAD-805, 1kHz waveform at 4W into 2 ohms (from the 4 ohm tap) (top); distortion and noise waveform with fundamental notched out (bottom).
At low frequencies and higher powers, the amplifier's distortion signature is less benign. The distortion spectrum resulting from a 50Hz input at 24W into 4 ohms (4 ohm tap) (approximately 2/3 of the power output at 3% THD+noise, 5dB feedback) is shown in fig.9. The distortion levels are relatively high: -33dB (about 2.5%) at 100Hz (second harmonic), -38.2dB (about 1.2%) at 150Hz. The distortion level does not drop below 0.1% until we reach the ninth harmonic (450Hz). At a much lower power output (4W, not shown), the distortion levels are lower: about 0.6% at 100Hz, dropping below 0.1% above 250Hz.
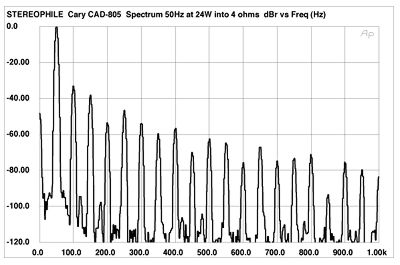
Fig.9 Cary CAD-805, spectrum of 50Hz sinewave, DC-1kHz, at 24W into 4 ohms (linear frequency scale). Note that the second harmonic at 100Hz is the highest in level, 33dB below the level of the 50Hz fundamental (2.5%).
Fig.10 shows the output resulting from an input of a combined 19+20kHz into 8 ohms at the 8 ohm tap. The output level here is 6.5W—just below the level at which clipping is observed in the output waveform with this input signal. Incidentally, clipping onset is quite gentle with the CAD-805, initially visible only as a slight rounding of the waveform's lower half (the bottom of the waveform shows signs of clipping before the top). The 1kHz intermodulation artifact lies at -29.3dB or about 3.5%—a very high level. The 2kHz and 3kHz IM products drop to just below 0.5%. The higher-frequency products are again high, reaching a maximum of -29dB (3.5%) at 18kHz. The corresponding results for a 4 ohm load, also into 6.5W, from the 4 ohm tap (not shown) were quite similar, with marginally higher—but not significantly so—distortion artifacts.
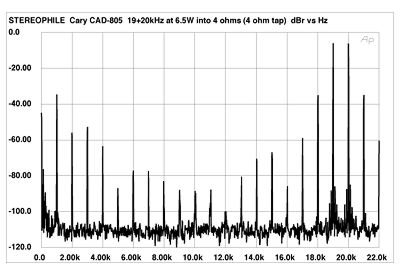
Fig.10 Cary CAD-805, HF intermodulation spectrum, DC-22kHz, 19+20kHz at 6.5W into 8 ohms (linear frequency scale).
The CAD-805's THD+noise vs level curves, with all three output taps driving an 8 ohm load, is shown in fig.11. Fig.12 shows the output into 2, 4, and 8 ohm loads from the 8 ohm tap, and fig.13 shows the effect of varying the amount of feedback into an 8 ohm load at the 8 ohm tap. The important data from all three of these curves, plus data for other taps and other loads which are not presented in graphical form for reasons of space, are shown in Table 2. The values shown in this Table were read directly from the appropriate graphs. The "knee" referred to here is the first point at which a major positive change in the distortion slope occurs. The main observation to be made from this table is, as might be expected, that the maximum output is available from the CAD-805 when the output tap selected matches the load impedance. While this is not necessarily true at the 1% THD+noise level, it's certainly the case at higher output. Note also that, whatever the pros and cons of negative feedback, the only configuration which produces more than 10W output at the 1% THD+noise point is the one having 10dB of feedback.

Fig.11 Cary CAD-805, distortion vs output power into 8 ohms, 5dB feedback, from (from bottom to top at 1W): 4 ohm tap, 8 ohm tap, and 16 ohm tap.
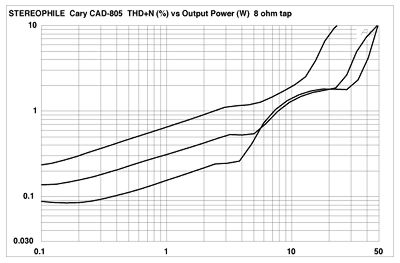
Fig.12 Cary CAD-805, distortion vs output power from 8 ohm tap into (from bottom to top at 1W): 8 ohms, 4 ohms, and 2 ohms.
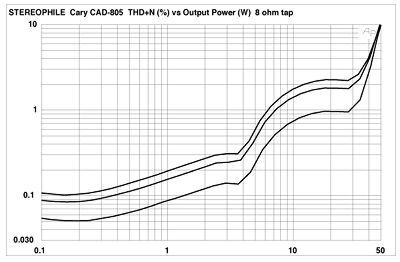
Fig.13 Cary CAD-805, distortion vs output power from 8 ohm tap into 8 ohms, with (from bottom to top at 1W): 10dB, 5dB, and 0dB feedback.
Table 2: Power Output
| Output | Output | 1% | 3% | |||
| Load | Tap | F/B | Knee | THD+N | THD+N | |
| ohms | ohms | dB | W | W | W | dBW |
| 16 | 16 | 5 | 3.9 | 9.5 | 41 | 19.1 |
| 8 | 8 | 5 | 3.8 | 7.2 | 37 | 15.7 |
| 8 | 4 | 5 | 2.3 | 4.5 | 20 | 13.0 |
| 8 | 16 | 5 | 5.0 | 9.5 | 28 | 14.5 |
| 8 | 8 | 0 | 3.6 | 6.3 | 35 | 15.4 |
| 8 | 8 | 10 | 3.7 | 28.0 | 41 | 16.1 |
| 4 | 16 | 5 | - | 3.0 | 15 | 8.75 |
| 4 | 8 | 5 | 5.0 | 7.8 | 28 | 11.5 |
| 4 | 4 | 5 | 3.9 | 6.1 | 35 | 12.4 |
| 2 | 16 | 5 | - | 0.7 | 6 | 1.75 |
| 2 | 8 | 5 | - | 2.4 | 15 | 5.75 |
| 2 | 4 | 5 | 4.8 | 6.8 | 27 | 8.3 |
The Cary's actual discrete clipping points (for the purposes of discussion, defined here as 3% THD+noise at 1kHz) for the 8 ohm tap, 5dB feedback, were 38.2W (15.8dBW) into 8 ohms, 28.9W (11.6dBW) into 4 ohms, and 14.4W (5.6dBW) into 2 ohms. From the 4 ohm tap, the corresponding values were 20.2W (13.1dBW) into 8 ohms, 35.9W (12.5dBW) into 4 ohms, and 28W (8.5dBW) into 2 ohms. And from the 16 ohm tap, 28.9W (14.6dBW) into 8 ohms, 14.4W (8.6dBW) into 4 ohms, and 6.4W (2.1dBW) into 2 ohms. All line voltages for these measurements were between 118V and 119V.
In classical terms, the CAD-805's test bench results cannot be categorized as anything other than mediocre, at best, even for a tube amplifier. As I stated in my measurement conclusions to the Jadis JA 200 review last November (Vol.16 No.11, p.153), such a set of measurements raises a question: Does the amplifier sound the way it does, in whole or in part, because or in spite of its objective performance? The former is not acceptable in a high-fidelity device, and certainly at least a number of the measured results on the CAD-805 fall within the boundaries of what we know to be audible deviations. And its power output, as DO states, restricts the user's choice of loudspeakers.
The CAD-805's somewhat nostalgia-inducing design is reinforced by its measured performance—an updated nostalgia, to be sure, but updating can only bring us so far in what is basically a half-century-old design concept, one long since abandoned for what would appear to be very good objective reasons. There is more to the story than measurements, of course; if you listen to the CAD-805s, fall in love with their sound, and can afford the price and loudspeaker restrictions, by all means buy them. But go into the purchase with open ears.—Thomas J. Norton