Sidebar 3: Measurements
I used DRA Labs' MLSSA system with a calibrated DPA 4006 microphone to measure the Acelec Model One's behavior in the farfield and an Earthworks QTC-40 mike for the nearfield responses. I measured the speaker's impedance magnitude and phase with Dayton Audio's DATS V2 system.


Overall, the Acelec Model One offers excellent measured behavior.—John Atkinson
Footnote 1: EPDR is the resistive load that gives rise to the same peak dissipation in an amplifier's output devices as the loudspeaker. See "Audio Power Amplifiers for Loudspeaker Loads," JAES, Vol.42 No.9, September 1994, and stereophile.com/reference/707heavy/index.html.
Fig.1 Acelec Model One, electrical impedance (solid) and phase (dashed) (2 ohms/vertical div.).
The Model One's specified sensitivity is 84dB/W/m; my B-weighted estimate was within experimental error of that figure, at 84.1dB(B)/2.83V/m. The Model One's nominal impedance is specified as 8 ohms, with a minimum value of 5 ohms at 375Hz. The speaker's impedance magnitude (fig.1, solid trace) remains between 5 and 8 ohms for most of the audioband but drops to 4.78 ohms at 380Hz. The electrical phase angle (dotted trace) is generally low, but the equivalent peak dissipation resistance, or EPDR (footnote 1), lies below 3 ohms between 92Hz and 240Hz, with a minimum value of 2.18 ohms at 124Hz, a frequency range where music can have high energy. The Model One needs to be used with amplifiers that don't have problems driving low impedances.
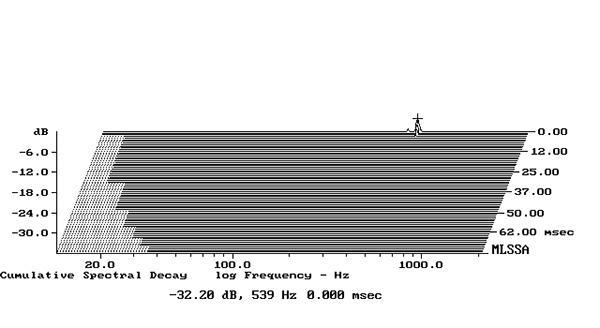
Fig.2 Acelec Model One, cumulative spectral-decay plot calculated from output of accelerometer fastened to center of sidewall (measurement bandwidth, 2kHz).
On its website, Acelec says that the enclosure is extremely stiff "to avoid any ringing effects," due to its use of bituminized aluminum panels. When I investigated the enclosure's side and top panels' vibrational behavior with a plastic-tape accelerometer, the only resonant mode I found lay at 539Hz (fig.2) but was extraordinarily low in level, supporting the manufacturer's claim.
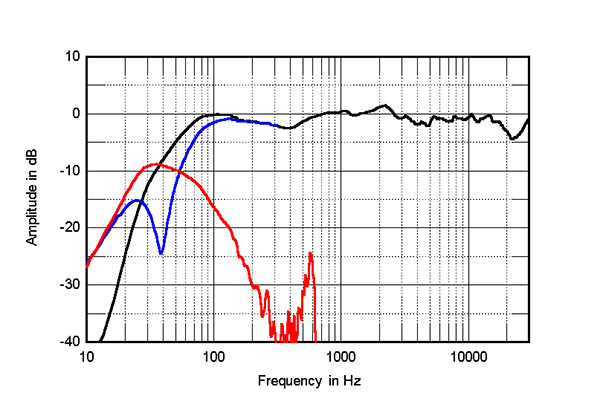
Fig.3 Acelec Model One, anechoic response on tweeter axis at 50", averaged across 30° horizontal window and corrected for microphone response, with the nearfield woofer (blue) and port (red) responses and their complex sum (black), respectively plotted below 300Hz, 650Hz, and 300Hz.
The Model One's impedance-magnitude plot has a saddle in the bass centered on 38Hz, which suggests that this is the tuning frequency of the port on the rear panel. The woofer's nearfield response (fig.3, blue trace) has the expected reflex notch at this frequency, and the port's output (fig.3, red trace) peaks between 25Hz and 75Hz. The port's upper-frequency rolloff is clean, though a low-level resonant peak is present just below 600Hz. The complex sum of the woofer and port responses is shown as the black trace below 300Hz in fig.3. The boost in the upper bass, which will mostly be an artifact of the nearfield measurement technique, is less pronounced than usual, which suggests that the Model One's reflex alignment is slightly overdamped, optimal for placement close to the front wall.
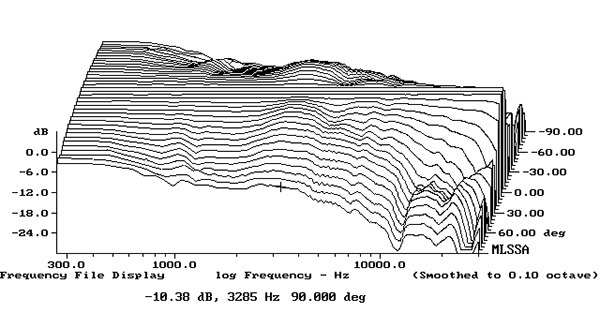
Fig.4 Acelec Model One, lateral response family at 50", normalized to response on tweeter axis, from back to front: differences in response 90–5° off axis, reference response, differences in response 5–90° off axis.
Fig.5 Acelec Model One, vertical response family at 50", normalized to response on tweeter axis, from back to front: differences in response 45–5° above axis, reference response, differences in response 5–45° below axis.
The Acelec speaker's farfield output, averaged across a 30° horizontal window centered on the tweeter axis (fig.3, black trace above 300Hz), has slightly depressed midrange and presence regions and a little too much energy in the low treble. The Model One's horizontal dispersion graph (fig.4) indicates that the presence-region depression tends to fill in off-axis; the output in the top two octaves, though, falls off more than 20° to the speaker's side. The most even treble balance will be with the speakers toed in to the listening position. In the vertical plane (fig.5), a suckout centered close to 2.5kHz (and not at the specified crossover frequency of 1.8kHz) appears more than 15° above and 10° below the tweeter axis. The Acelec should be used on a stand that places the tweeter axis close to the listener's ears.
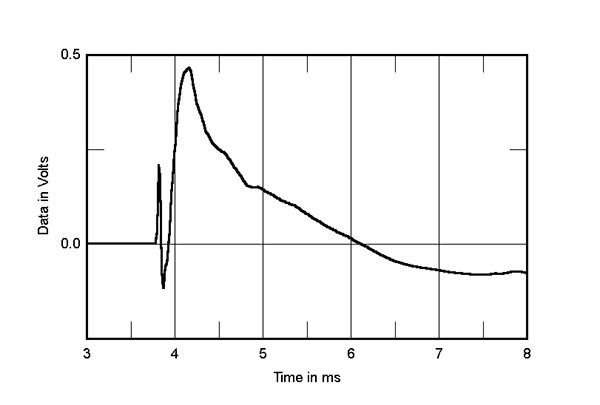
Fig.6 Acelec Model One, step response on tweeter axis at 50" (5ms time window, 30kHz bandwidth).
Fig.7 Acelec Model One, cumulative spectral-decay plot on tweeter axis at 50" (0.15ms risetime).
In the time domain, fig.6 shows the Model One's step response on the tweeter axis. The two drivers are connected in positive acoustic polarity, the tweeter's output arriving first at the microphone. The positive-going decay of the tweeter's step blends smoothly with the start of the woofer's step, which indicates an optimal crossover implementation. The Acelec speaker's cumulative spectral-decay, or waterfall, plot (fig.7) is impressively clean. (Ignore the apparent low-level ridge of delayed energy just below 16kHz, which will be due to interference from the MLSSA host PC's video circuitry.)
Footnote 1: EPDR is the resistive load that gives rise to the same peak dissipation in an amplifier's output devices as the loudspeaker. See "Audio Power Amplifiers for Loudspeaker Loads," JAES, Vol.42 No.9, September 1994, and stereophile.com/reference/707heavy/index.html.