Sidebar 3: Measurements
I performed a full set of measurements on the Linear Tube Audio ZOTL40 Mk.II, using my Audio Precision SYS2722 system (see the January 2008 "As We See It"). The ZOTL40's voltage gain into 8 ohms measured a lower-than-average 21.1dB from both its Direct and Volume Control unbalanced inputs, and both inputs preserved absolute polarity (ie, were non-inverting). The Direct input impedance measured 44.5k ohms at low and middle frequencies, dropping to a still high 39k ohms at 20kHz. Via the Volume Control input, the input impedance was lower, at close to 23k ohms across the audioband.
The output impedance was moderately high, at 1.05 ohms at 20Hz and 1kHz, increasing to 1.65 ohms at 20kHz. As a result, there were response variations up to ±0.9dB with our standard simulated loudspeaker (fig.1 gray trace). Into 8 ohms (blue and red traces), the response extended very high, not reaching –3dB until 120kHz, this correlating with the superbly defined shape of a 10kHz squarewave into this load (fig.2). A slight amount of overshoot is visible in this graph, though there is no ringing. Note the extended low-frequency response in fig.1. The bandwidth reduces into 4 ohms (fig.1, cyan and magenta traces), and into 2 ohms (green trace), the output is down by 3dB at 30kHz. These response curves were taken via the ZOTL40's Direct input; via the Volume Control input, the bandwidth was reduced at lower settings of the control and a 1dB imbalance in favor of the right channel had developed by the unity-gain position of the control.
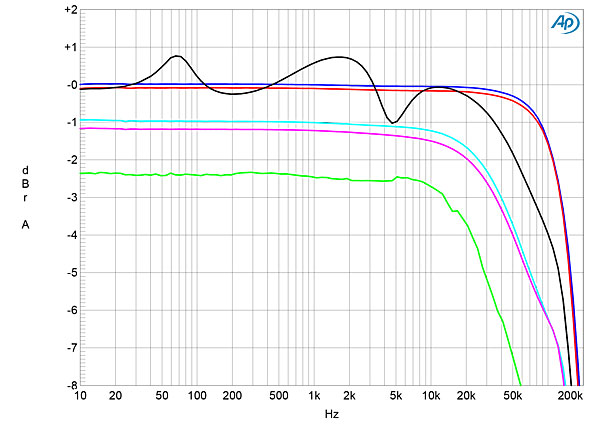
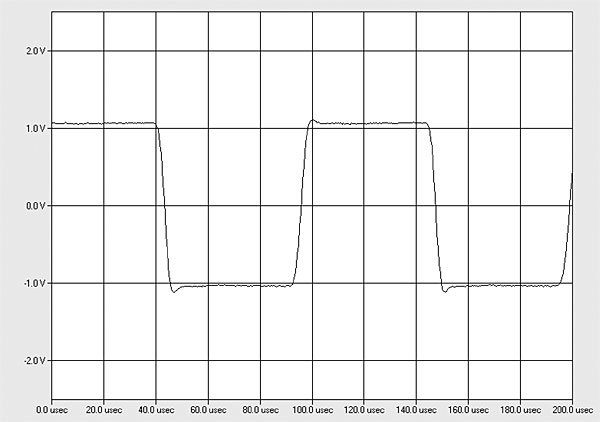
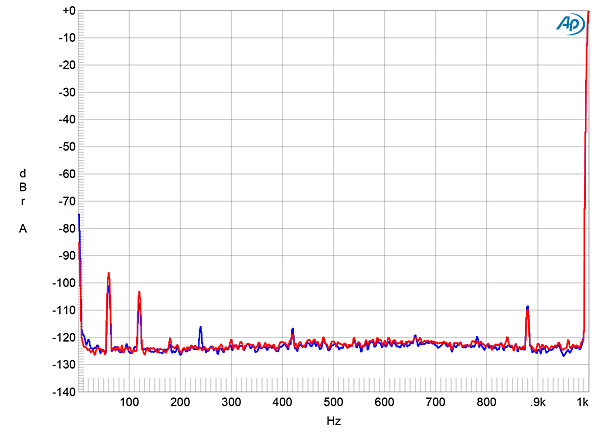
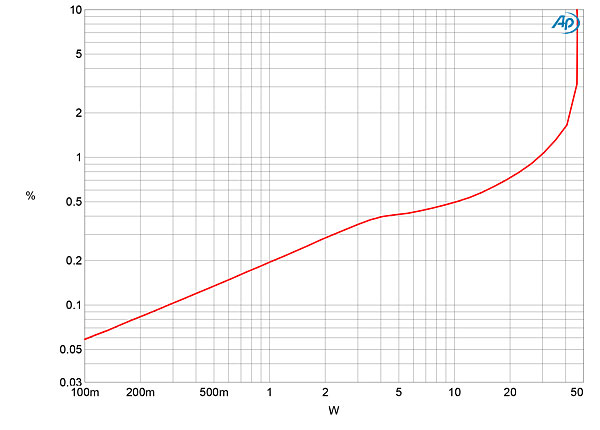
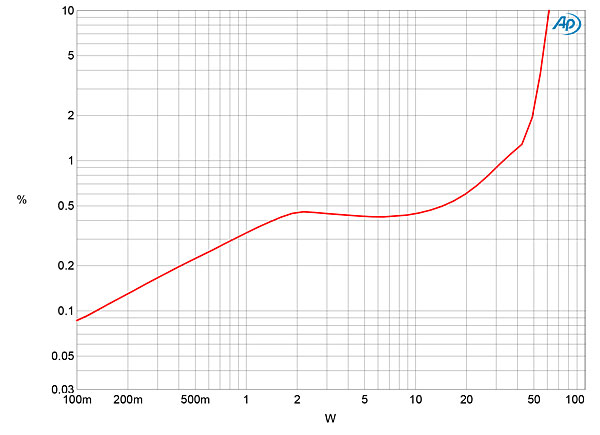
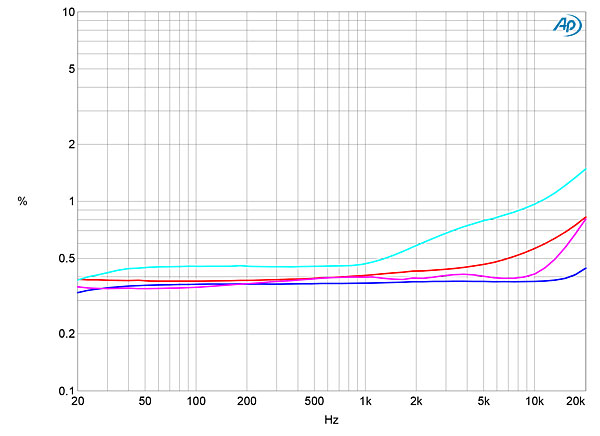
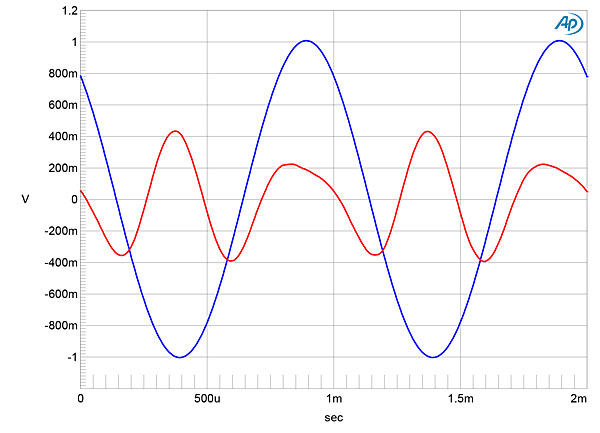
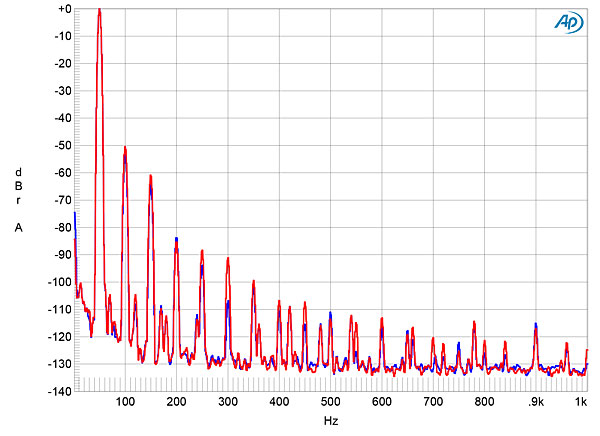
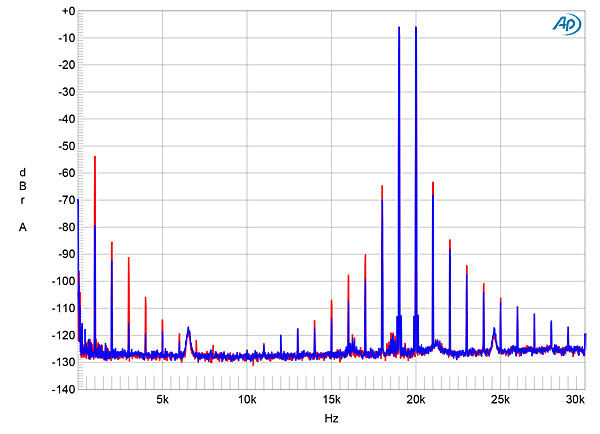
Fig.1 ZOTL40 Mk.II, balanced frequency response at 2.83V into: simulated loudspeaker load (gray), 8 ohms (left channel blue, right red), 4 ohms (left cyan, right magenta), 2 ohms (green) (0.5dB/vertical div.).
Fig.2 ZOTL40 Mk.II, small-signal, 10kHz squarewave into 8 ohms.
Channel separation was disappointing, at 46dB in both directions at low frequencies, increasing slightly to 54dB in the mid treble. Despite the presence of an FM carrier frequency to allow the use of tiny output transformers, the wideband, unweighted S/N ratio, ref. 1W into 8 ohms and taken with the input shorted to ground, was good at 60.1dB (average of both channels), This improved to a superb 93.7dB when the measurement bandwidth was restricted to the audioband and even further, to 99.3dB when A-weighted. The spectrum of the ZOTL40's output while it drove 1kHz at 1W into 8 ohms (fig.3) was very clean, with just a trace of supply-related spuriae present at 60Hz and 120Hz.
Fig.3 ZOTL40 Mk.II, spectrum of 1kHz sinewave, DC–1kHz, at 1W into 8 ohms (linear frequency scale).
Distortion into 8 ohms was very low at low powers with both channels driven (fig.4) but rose in a linear fashion with power, reaching 1% at 30Wpc (14.75dBW). The amplifier reached its specified maximum power of 46W into 8 ohms (16.6dBW) at 3% THD+N. The picture was very similar into 4 ohms (fig.5), with 32Wpc (12dBW) available at 1% THD+N and 60Wpc (14.8dBW) at 10% THD+N. This is pretty respectable power delivery for a pair of KT77 tubes.
Fig.4 ZOTL40 Mk.II, both channels driven, distortion (%) vs 1kHz continuous output power into 8 ohms.
Fig.5 ZOTL40 Mk.II, both channels driven, distortion (%) vs 1kHz continuous output power into 4 ohms.
Measured at 4.9V, which is equivalent to 3W into 8 ohms, 6W into 4 ohms, and 12W into 2 ohms, the distortion remained relatively constant across the audioband in the right channel into 8 and 4 ohms (fig.6, red and magenta traces), though it did rise at high frequencies in the left channel into 4 ohms (cyan trace). Fortunately, the distortion was predominantly low-order in nature (fig.7), though some higher-order harmonics are present, albeit at low levels (fig.8). Finally, the left channel (blue trace) performed much better than the right (red trace) when it came to intermodulation distortion (flg.9). The difference product at 1kHz lay at a respectably low –79dB (0.01%) in the left channel but at –54dB (0.2%) in the right. Perhaps an output tube was starting to fail in that channel.
Fig.6 ZOTL40 Mk.II, THD+N (%) vs frequency at 4.9V into: 8 ohms (left channel blue, right red) and 4 ohms (left cyan, right magenta).
Fig.7 ZOTL40 Mk.II, 1kHz waveform at 1W into 8 ohms, 0.227% THD+N (blue); distortion and noise waveform with fundamental notched out (red, not to scale).
Fig.8 ZOTL40 Mk.II, spectrum of 50Hz sinewave, DC–1kHz, at 1W into 8 ohms (linear frequency scale).
Fig.9 ZOTL40 Mk.II, HF intermodulation spectrum, DC–24kHz, 19+20kHz at 1W peak into 8 ohms (linear frequency scale).
David Berning's amplifier designs are always well-thought-out as is the Linear Tube Audio ZOTL40. However, it's fair to note that its distortion is higher in level at moderate powers and above than stated in the specification.—John Atkinson


