Sidebar 3: Measurements
Before performing any measurements, I ran one of the Lamm ML3 Signature amplifiers (serial no. G10029) for an hour at 1W into 8 ohms from its 4 ohm tap. At the end of that period, I muted the input signal and checked the plate current of the GM70 output tube using the two test points on the top panel and Lamm's recommended Fluke 87 multimeter. The wall voltage was 119.3V; the test-point reading was 1.172V DC, which is out of the recommended range of 1.078–1.122V. Using the multi-turn potentiometer that's visible through a circular cutout in the top panel, I reduced the plate current until the reading was 1.103V.
That adjustment made, I performed full sets of measurements from each of the ML3's three output-transformer taps, using Stereophile's loan sample of the top-of-the-line Audio Precision SYS2722 system (see www.ap.com and the January 2008 "As We See It"). I then repeated some of the tests with the output stage's negative feedback (NFB) switches set to their two positions. As the XLR input is provided for convenience but simply parallels the single-ended RCA jack with pin 3 connected to ground, I used the single-ended input exclusively for the tests.
The ML3's input impedance was the specified 41k ohms at 20Hz and 1kHz, dropping to 17k ohms at 20kHz. This drop is most likely inconsequential. The amplifier preserved absolute polarity (ie, was non-inverting) from all three transformer taps. The voltage gain at 1kHz, measured into 8 ohms, was 23.6dB from the 4 ohm tap, 25.3dB from the 8 ohm tap, and 26.2dB from the 16 ohm tap. Looking at the effect of the NFB switches, NFB2 reduced the gain into 8 ohms from the 4 ohm tap to 21.6dB, NFB1 to 20.4dB. With the input shorted and assessed from the 8 ohm tap, the ML3's wideband signal/noise ratio (ref. 2.83V into 8 ohms) was okay at 63.8dB. Restricting the measurement bandwidth to the audioband increased the ratio to a good 86.1dB, while A-weighting increased it further, to 94.9dB.
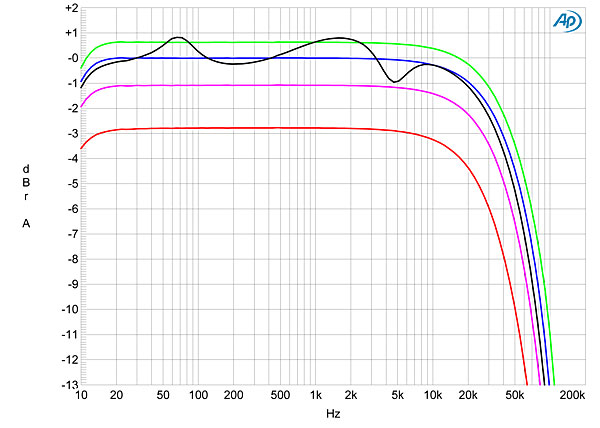
Even without any negative feedback, the 4 ohm tap's output impedance was moderately low for a single-ended design, at 1.55 ohms at low and middle frequencies, rising to 1.9 ohms at the top of the audioband. As a result, the modification of the amplifier's frequency response by the Ohm's law interaction between that output impedance and the impedance of our standard simulated loudspeaker remained within ±0.9dB (fig.1, gray trace). Applying 1.2dB of NFB reduced the output impedance from this tap to 1.25 ohms at 20Hz and 1kHz, 1.4 ohms at 20kHz; 2.4dB of NFB further reduced the impedance to 1.1 and 1.2 ohms, respectively.


 The measured performance of Lamm's ML3 Signature may well raise eyebrows, but it actually measures well for an amplifier with a single-ended output stage. The measurements do show that it is important to use the lowest-possible output-transformer tap with any particular loudspeaker. But when that is done, the ML3 sounds more powerful than it has any right to. When I drove up to Michael Fremer's place to pick up the Lamms, and before we packed them up, I listened to my rough mixes of an Attention Screen concert with the ML3s driving his Wilson Alexandria XLF speakers, recordings that I know intimately well. I have listened to these speakers in previous visits to Michael's, when they were driven by Dan D'Agostino Momentums and darTZeel NHB-458s; as good as those solid-state monoblocks sounded with the Wilsons, I must say that the Lamm ML3s driving the XLFs was magical.—John Atkinson
Fig.1 Lamm ML3 Signature, 4 ohm tap, frequency response at 1V into: simulated loudspeaker load (gray), 16 ohms (green), 8 ohms (blue), 4 ohms (magenta), 2 ohms (red) (1dB/vertical div.).
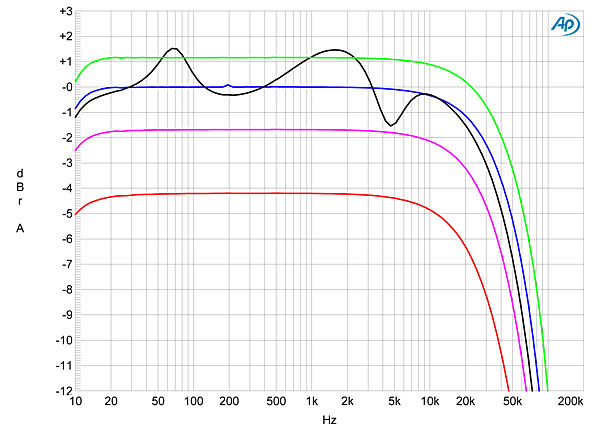
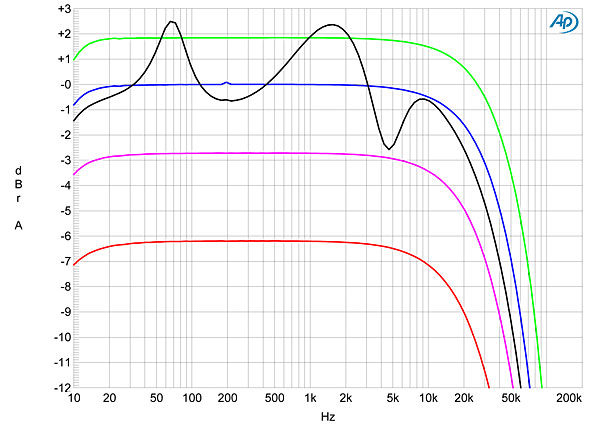
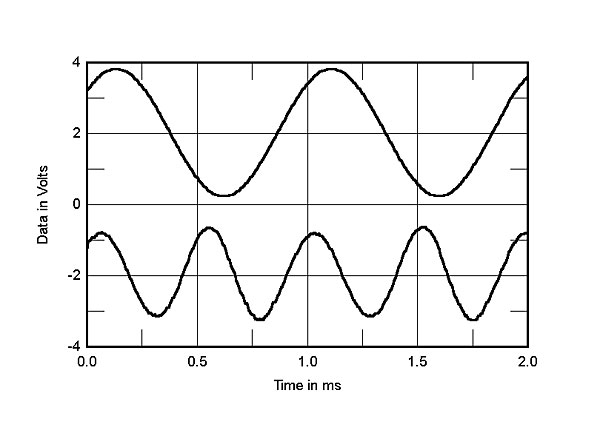
Without NFB, the output impedance was much higher from the other taps, the 8 ohm tap measuring 2.9–3.9 ohms, the 16 ohm tap 6–8.5 ohms, both depending on frequency. Consequently, the modification of the frequency response with our simulated loudspeaker was more severe than from the 4 ohm tap, at ±1.5dB from the 8 ohm tap (fig.2, gray trace) and ±2.4dB from the 16 ohm tap (fig.3, gray trace). The response rolls off above the audioband from all taps, causing an increase in the risetime of a 10kHz squarewave (fig.4). But the commendably extended extension at low frequencies seen in figs.1–3 leads to an impressively accurate reproduction of a 1kHz squarewave, with flat waveform tops and bottoms (fig.5).
Fig.2 Lamm ML3 Signature, 8 ohm tap, frequency response at 1V into: simulated loudspeaker load (gray), 16 ohms (green), 8 ohms (blue), 4 ohms (magenta), 2 ohms (red) (1dB/vertical div.).
Fig.3 Lamm ML3 Signature, 16 ohm tap, frequency response at 1V into: simulated loudspeaker load (gray), 16 ohms (green), 8 ohms (blue), 4 ohms (magenta), 2 ohms (red) (1dB/vertical div.).
Fig.4 Lamm ML3 Signature, 4 ohm tap, small-signal 10kHz squarewave into 8 ohms.
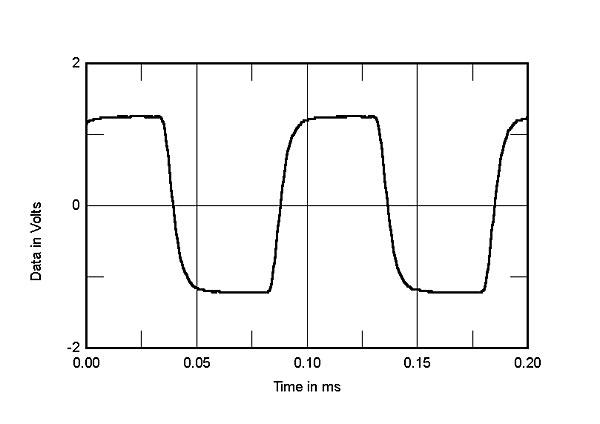
Fig.5 Lamm ML3 Signature, 4 ohm tap, small-signal 1kHz squarewave into 8 ohms.
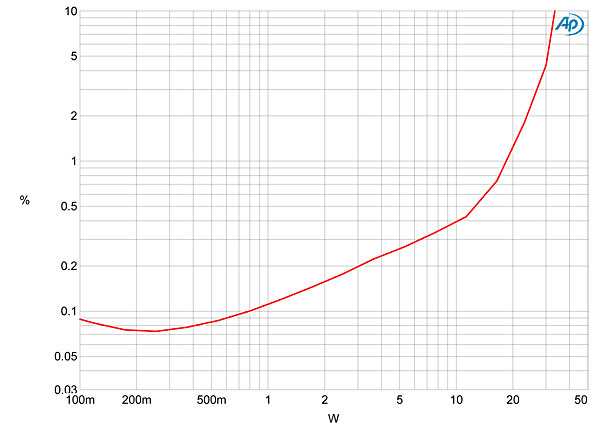
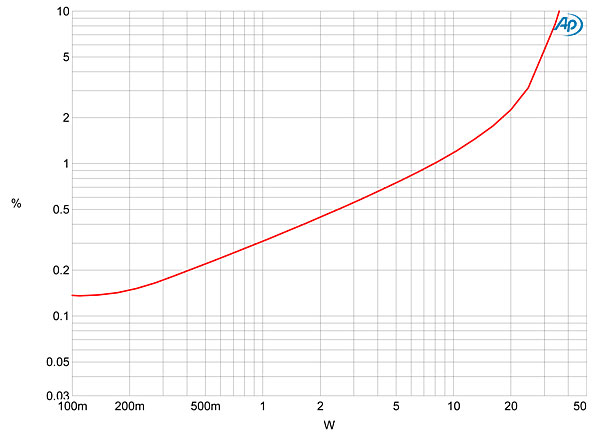
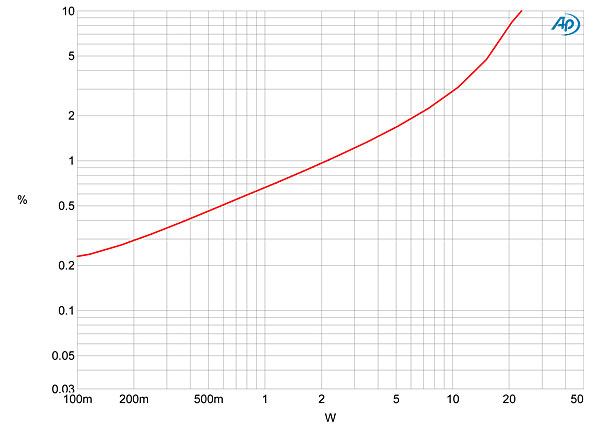
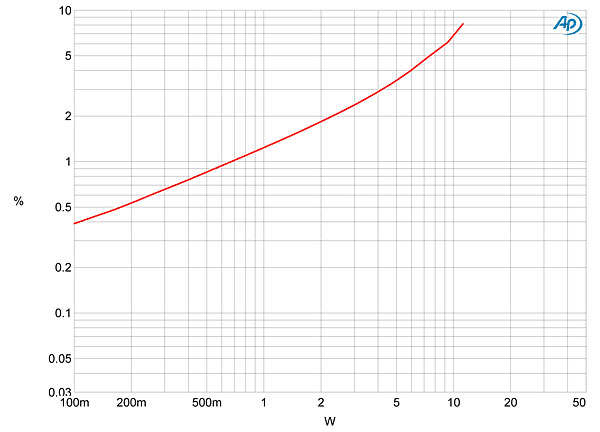
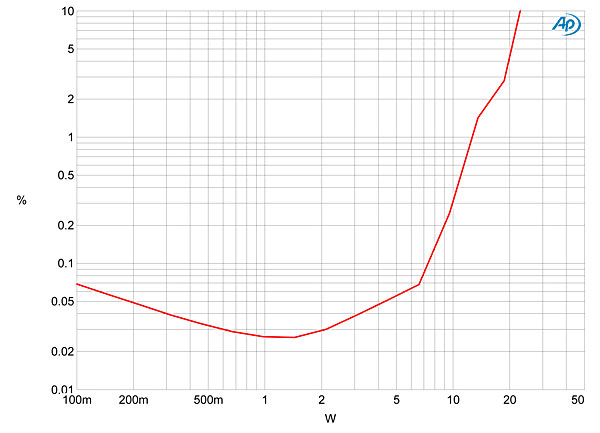
The GM70 tube is run at 1200V on its plate to get it to operate in the most linear region of its transfer function. Even so, it is not that linear, especially into low impedances. Although I measured how the percentage of THD+noise changed with output power from all three output-transformer taps, I have shown only the results from the 8 ohm tap, into 16, 8, 4, and 2 ohms (figs.6–9); the overall picture was the same from the 4 and 16 ohm taps. With the load impedance twice the nominal value of the transformer tap, the THD starts to rise above the noise floor at a few hundred milliwatts, then rises linearly with power until the amplifier starts to clip at around 10W, reaching 3% THD at 25W. As the load impedance drops, the THD+N is higher at lower powers, and the power at which the THD reaches 1% drops. With the load half the transformer-tap value, the power at 3% is around 10W; and with a further halving of the load impedance, the ML3 is nonlinear even at low powers. Fig.10 shows the ML3 at its linear best, with the 4 ohm tap driving 16 ohms. The small-signal distortion is impressively low for a single-ended amplifier operating without the palliative effect of negative feedback. The THD+N remains below 0.05% until the output power reaches 4.5W, with the THD reaching 1% at 12W (13.7dBW), and 3% just below 20W (16dBW).
Fig.6 Lamm ML3 Signature, 8 ohm tap, distortion (%) vs 1kHz continuous output power into 16 ohms.
Fig.7 Lamm ML3 Signature, 8 ohm tap, distortion (%) vs 1kHz continuous output power into 8 ohms.
Fig.8 Lamm ML3 Signature, 8 ohm tap, distortion (%) vs 1kHz continuous output power into 4 ohms.
Fig.9 Lamm ML3 Signature, 8 ohm tap, distortion (%) vs 1kHz continuous output power into 2 ohms.
Fig.10 Lamm ML3 Signature, 4 ohm tap, distortion (%) vs 1kHz continuous output power into 16 ohms.
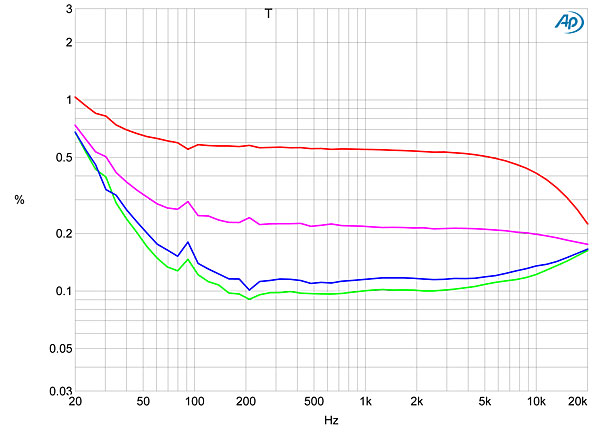
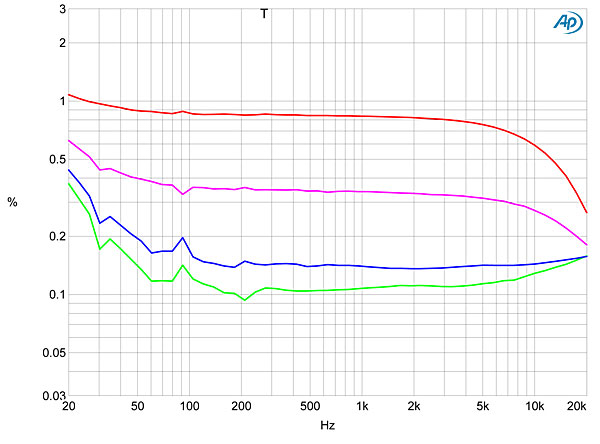
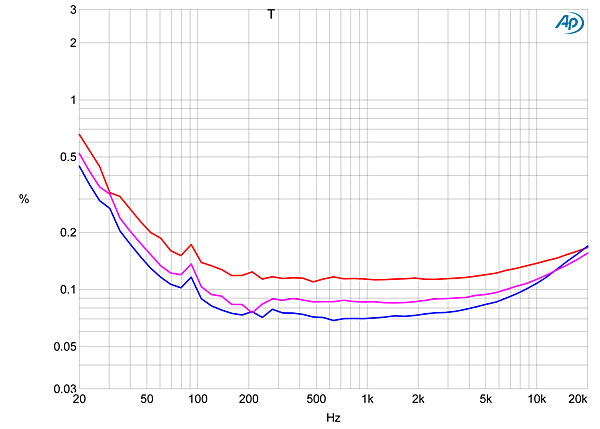
Fig.11 shows how the THD+N percentage changes with frequency at low power with the 4 ohm tap driving loads from 2 to 16 ohms. (The behavior from the 8 and 16 ohm taps, figs.12 and 13,, is very similar but with increasingly higher distortion overall.) Again, the amplifier is most linear when the load impedance is at or above the nominal transformer-tap value. The distortion starts to rise in the low bass, due to the transformer core starting to saturate, but the rise is low in absolute terms. This is a good transformer. The effect of the two NFB settings is shown in fig.14: each increase in the amount of NFB reduces the level of midband distortion by about 20%.
Fig.11 Lamm ML3 Signature, 4 ohm tap, THD+N (%) vs frequency at 1V into: 16 ohms (green), 8 ohms (blue), 4 ohms (magenta), 2 ohms (red).
Fig.12 Lamm ML3 Signature, 8 ohm tap, THD+N (%) vs frequency at 1V into: 16 ohms (green), 8 ohms (blue), 4 ohms (magenta), 2 ohms (red).
Fig.13 Lamm ML3 Signature, 16 ohm tap, THD+N (%) vs frequency at 1V into: 16 ohms (green), 8 ohms (blue), 4 ohms (magenta), 2 ohms (red).
Fig.14 Lamm ML3 Signature, 4 ohm tap, THD+N (%) vs frequency at 1V into 8 ohms with 0dB NFB (red), 1.2dB NFB (magenta), 2.4dB NFB (blue).
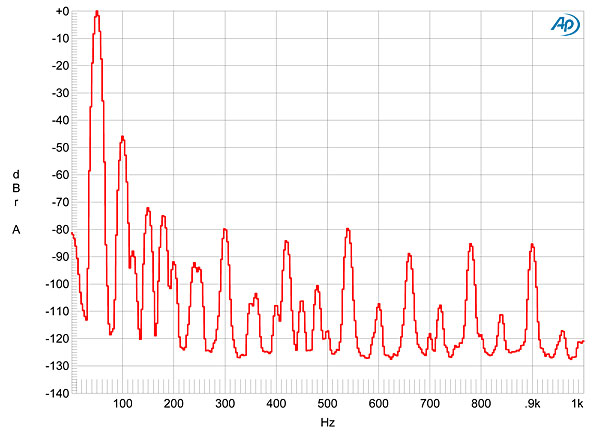
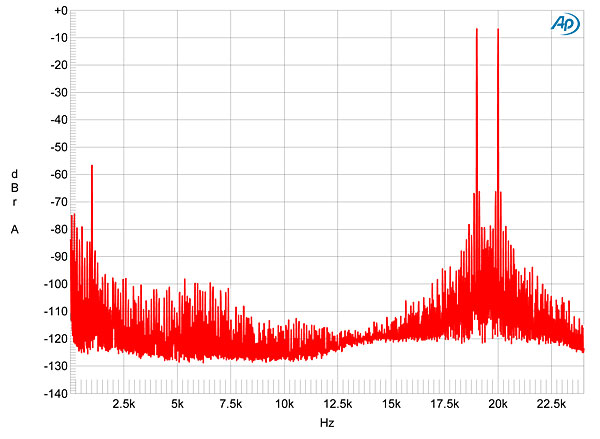
As is typical of single-ended tube amplifiers, the ML3's distortion signature is heavily second harmonic (fig.15), which will work against the audibility of the circuit's fundamental nonlinearity. However, even at low powers, the spectrum of the ML3's output has spurious components visible at 60Hz and at both its even- and odd-order harmonics (fig.16), with the odd-order components (other than the third harmonic) each lying close to –80dB (0.01%). Even so, the third harmonic of the AC supply lies at –77dB (0.014%). The same behavior can be seen in fig.17, which shows the spectrum of the ML3's output while it reproduces an equal mix of 19 and 20kHz tones at 1 W into 8 ohms from the 8 ohm output tap.
Fig.15 Lamm ML3 Signature, 4 ohm tap, 1kHz waveform at 1W into 8 ohms, 0.199% THD+N (top); distortion and noise waveform with fundamental notched out (bottom, not to scale).
Fig.16 Lamm ML3 Signature, 8 ohm tap, spectrum of 50Hz sinewave, DC-1kHz, at 1W into 8 ohms (linear frequency scale).
Fig.17 Lamm ML3 Signature, 8 ohm tap, HF intermodulation spectrum, DC-24kHz, 19+20kHz at 1W peak into 8 ohms (linear frequency scale).