Sidebar 3: Measurements
When I unpacked the RS520 sample reviewed by RvB, I heard something metallic rattling around inside the amplifier. The nut holding one of the speaker binding posts to the printed circuit board on the back panel had come undone. I found the binding post inside the shipping box, and when I removed the top cover, I found the nut inside the amplifier. I reattached the binding post, but when I removed the top panel, the two ribbon cables that connect it to the main circuit board detached. As hard as I tried, I couldn't manage to reattach these cables. I requested a new sample of the RS520, which was promptly supplied. I measured serial number EBK302CB000118.
I performed the measurements using my Audio Precision SYS2722 system. As the HiFi Rose is a class-D design and class-D amplifiers emit relatively high levels of ultrasonic noise that would drive the analyzer's input into slew-rate limiting, all the measurements other than frequency response were taken with Audio Precision's AUX-0025 passive auxiliary low-pass filter. (The AUX-0025 mitigates noise above 80kHz and eliminates noise above 200kHz.) Without the filter, 760mV of ultrasonic noise was present at the left channel's loudspeaker terminals, 860mV at the right channel's, both with a center frequency of 570kHz. After a few hours of testing, the amplifier's top panel was warm, at 98.4°F/36.9°C.
I left the amplifier's Software Volume Control turned off for all the measurements. The Pre output level was set to its default value. Looking first at the single-ended analog line input, with the HiFi Rose's volume control set to its maximum—the control operates in accurate 0.5dB steps—the voltage gain at 1kHz into 8 ohms measured 28.5dB from the speaker terminals and 1.7dB from the preamplifier output. The line input preserved absolute polarity (ie, was noninverting) from both output types, and the input impedance was low, at close to 3.3k ohms across the audioband. (The specified input impedance is 100k ohms.)


Turning to the RS520's digital inputs, I used the Audio Precision's optical and coaxial S/PDIF outputs and sent test signals to the amplifier via Ethernet from Roon and by USB from my MacBook Pro. The RS520's S/PDIF inputs locked to datastreams with sample rates up to 192kHz. Apple's USB Prober app identified the HiFi Rose as "RS520-DAC" and showed that the USB port operates in the optimal isochronous asynchronous mode. Apple's AudioMIDI utility indicated that the RS520 accepts 16- and 32-bit integer data sampled at all rates from 44.1kHz to 768kHz via USB.
With the volume control set to its maximum, a 1kHz digital signal at –20dBFS resulted in an output level of 4.52V into 8 ohms from the loudspeaker output, which is 0.3dB below the clipping voltage into this load with a 0dBFS signal. The HiFi Rose's gain architecture is well-arranged. Nevertheless, I turned off the speaker outputs for the digital input testing, examining the signal at the Pre outputs. Data at 0dBFS gave a maximum level of 2.08V from the preamplifier output.

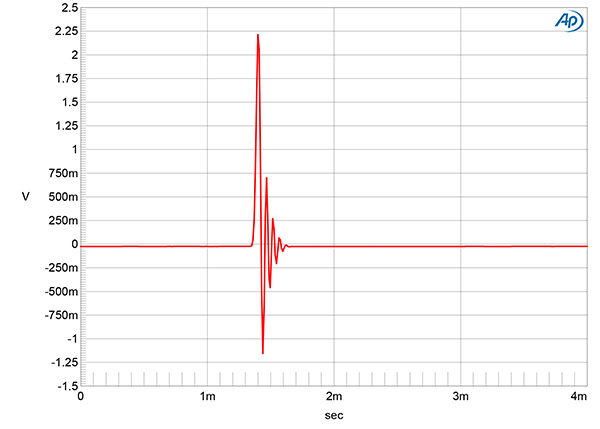
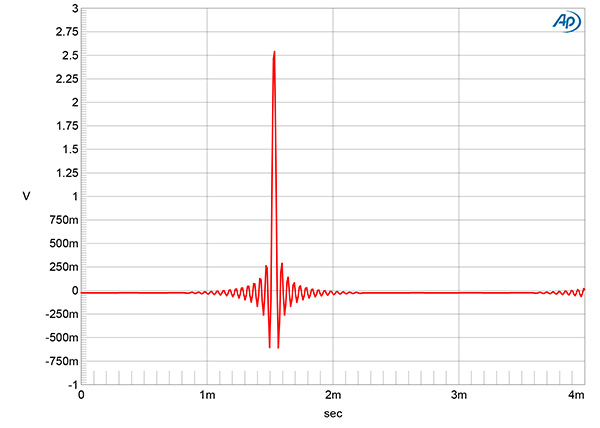

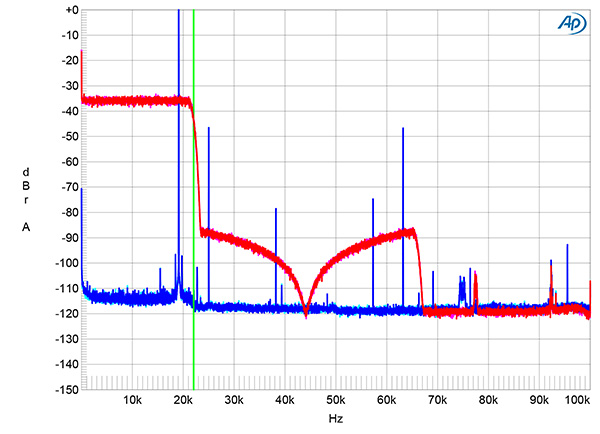
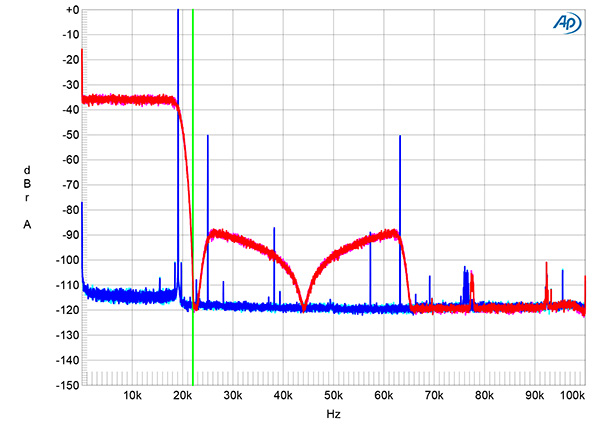
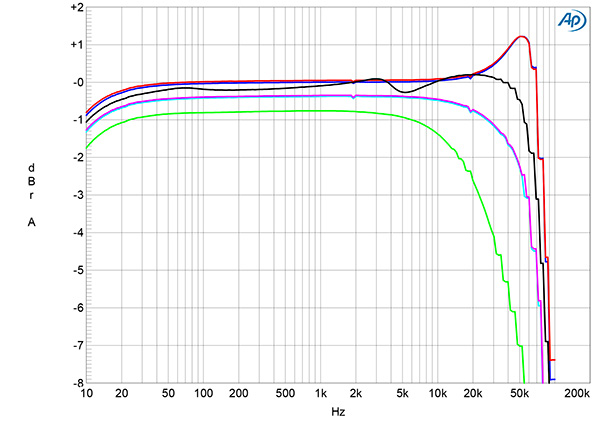
Fig.1 HiFi Rose RS520, line input, frequency response at 2.83V into: simulated loudspeaker load (gray), 8 ohms (left channel blue, right red), 4 ohms (left cyan, right magenta), 2 ohms (green) (1dB/vertical div.).
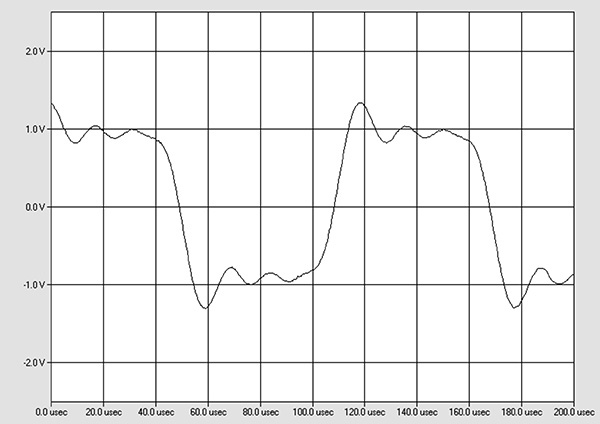
Fig.2 HiFi Rose RS520, line input, small-signal, 1kHz squarewave into 8 ohms.
The preamplifier output impedance was 302 ohms from 20Hz to 20kHz; the impedance at the speaker terminals was a low 0.11 ohm at 20Hz and 1kHz, rising to 0.4 ohm at 20kHz. (These values include the series resistance of 6' of spaced-pair speaker cable.) Consequently, the variation in frequency response with our standard simulated loudspeaker, taken without the AP low-pass filter (fig.1, gray trace), was minimal, though the output rolled off earlier in the top octave with low-impedance loads (fig.1, cyan, magenta, and green traces) than it did into 8 ohms (fig.1, blue and red traces). A slight rise in response can be seen above the audioband into 8 ohms, which correlates with an overshoot and ringing on the waveform's leading edges with the RS520's reproduction of a 10kHz squarewave into this load (fig.2). Fig.1 was taken with the volume control set to its maximum; the superb channel matching was preserved at lower settings of the control.
Fig.3 HiFi Rose RS520, line input, spectrum of 1kHz sinewave, DC–1kHz, at 1W into 8 ohms with volume control set to the maximum (left channel blue, right red) (linear frequency scale).
Channel separation above 2kHz was okay, at >60dB in both directions, but decreased to 50dB at 100Hz and below. With the Audio Precision ultrasonic filter, the RS520's line inputs shorted to ground, and with the volume control set to the maximum, the wideband, unweighted signal/noise ratio (ref. 2.83V into 8 ohms) measured 54.4dB in both channels. Restricting the measurement bandwidth to 22kHz increased the ratio to 76dB, and an A-weighting filter increased it further, to 84.5dB. Spectral analysis of the HiFi Rose's low-frequency noisefloor (fig.3) revealed no AC power-line–related spuriae, though the 1kHz tone has a sideband at 880Hz (1000Hz–120Hz). This graph was taken with the volume control set to its maximum, but the spectrum didn't change significantly with the volume reduced by 12dB.
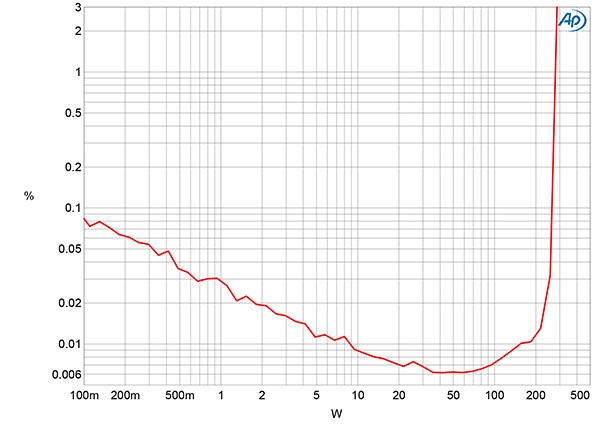
Fig.4 HiFi Rose RS520, line input, THD+N (%) vs 1kHz continuous output power into 8 ohms.
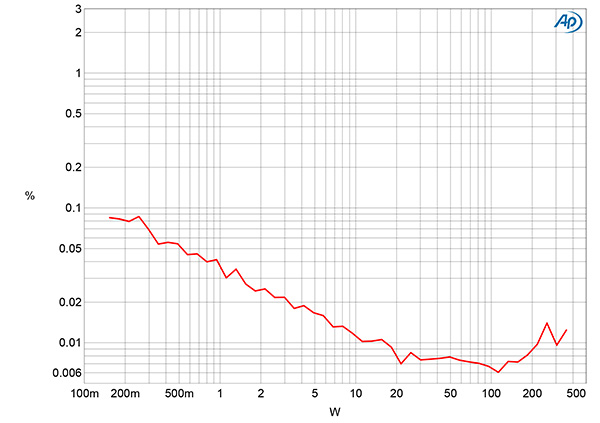
Fig.5 HiFi Rose RS520, line input, THD+N (%) vs 1kHz continuous output power into 4 ohms.
The RS520 is specified as delivering a maximum output power of 250Wpc into both 8 ohms and 4 ohms (24dBW and 21dBW, respectively). With our usual definition of clipping—when the THD+N reaches 1%—and with both channels driven, the RS520 clipped at 275Wpc into 8 ohms (24.4dBW, fig.4). The downward slope below 50W in this graph indicates that the reading is dominated by noise, with distortion rising above the noisefloor at higher powers. I couldn't test the clipping power into 4 ohms, as the amplifier went into protection at 357Wpc (22.55dBW, fig.5), well above the rated power.
Fig.6 HiFi Rose RS520, THD+N (%) vs frequency at 12.67V into: 8 ohms (left channel blue, right red), and 4 ohms (left green, right gray).
The distortion levels at 12.67V, which is equivalent to 20W into 8 ohms and 40W into 4 ohms (fig.6), were very low above 500Hz. (To avoid having the measured percentage corrupted by high-frequency noise, even with the auxiliary AP filter, I used a brickwall low-pass filter set to a 40kHz passband, which is why this graph only extends to 10kHz.) However, the THD+N rose below that frequency, exceeding 0.1% (–60dB) in the low bass.
Fig.7 HiFi Rose RS520, line input, 1kHz waveform at 20W into 8 ohms, 0.006% THD+N (top); distortion and noise waveform with fundamental notched out (bottom, not to scale).
Fig.8 HiFi Rose RS520, line input, spectrum of 50Hz sinewave, DC–1kHz, at 20Wpc into 8 ohms (left channel blue, right red; linear frequency scale).
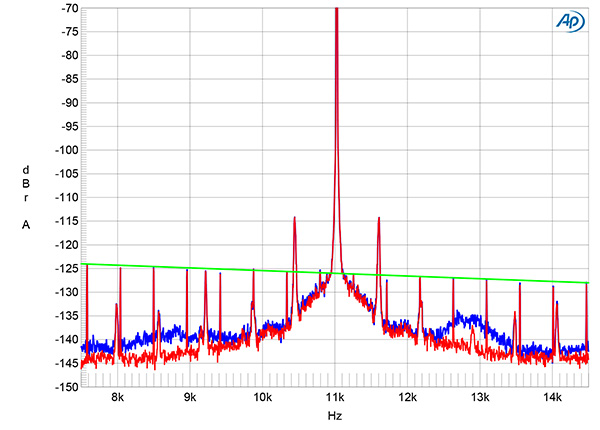
Fig.9 HiFi Rose RS520, line input, spectrum of 1kHz sinewave, DC–1kHz, at 20Wpc into 8 ohms (left channel blue, right red; linear frequency scale).
The distortion signature appears to be primarily second harmonic in nature at 1kHz (fig.7) and third harmonic at 50Hz (fig.8). As shown in fig.6, the distortion was much higher with the 50Hz signal than it was with the 1kHz signal (fig.9). Note the sidebands of the spectral spike at 1kHz in fig.9 at ±120Hz. I experimented with the grounding between the RS520 and the Audio Precision, including connecting a wire between the ground terminal on the amplifier's rear panel and the analyzer's chassis ground, but I could not eliminate these sidebands.
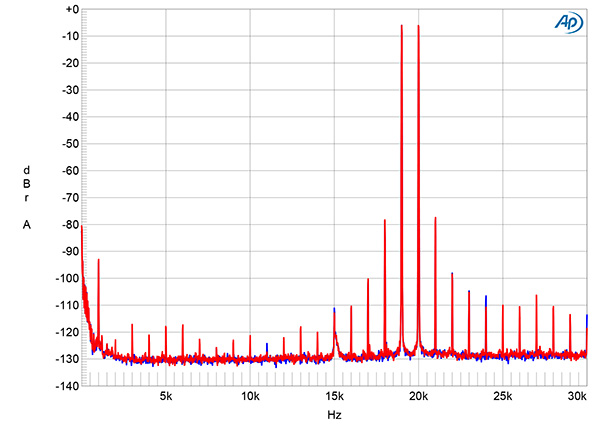
Fig.10 HiFi Rose RS520, line input, HF intermodulation spectrum, DC–30kHz, 19+20kHz at 50Wpc peak into 8 ohms (left channel blue, right red; linear frequency scale).
Intermodulation distortion was very low (fig.10), the difference product at 1kHz lying at –94dB (0.002%), the higher-order products at 18kHz and 21kHz at –79dB (0.01%).
Fig.11 HiFi Rose RS520, digital input, "Minimum Phase Fast Roll-off" filter, impulse response (one sample at 0dBFS, 44.1kHz sampling, 4ms time window).
Fig.12 HiFi Rose RS520, digital input, "Minimum Phase, Slow Roll-off" filter, impulse response (one sample at 0dBFS, 44.1kHz sampling, 4ms time window).
Fig.13 HiFi Rose RS520, digital input, "Apodizing Fast Roll-off" filter, impulse response (one sample at 0dBFS, 44.1kHz sampling, 4ms time window).
Fig.14 HiFi Rose RS520, digital input, "Corrected Minimum Phase Fast Roll-off" filter, impulse response (one sample at 0dBFS, 44.1kHz sampling, 4ms time window).
With S/PDIF and Ethernet data, the HiFi Rose's reconstruction filter can be set to one of seven types with the front-panel's touchscreen. With the filter set to "Minimum Phase Fast Roll-off," which was both the default filter and the only filter operating with USB data, the impulse response with 44.1kHz data (fig.11) was typical of a long minimum-phase type, with all the ringing following the single sample at 0dBFS. As expected, the "Minimum Phase Slow Roll-off" filter was a shorter minimum-phase type (fig.12). The "Apodizing Fast Roll-off" (fig.13), "Linear Phase Fast Roll-off," and "Brickwall" filters were all long linear-phase types, with equal amounts of ringing before and after the single high sample. The "Linear Phase Slow Roll-off" filter's impulse response was shorter, and the "Corrected Minimum Phase Fast Roll-off" (fig. 14) filter was the familiar hybrid type seen in our reviews of other digital processors that use the ESS Sabre chip set (footnote 1).
Fig.15 HiFi Rose RS520, digital input, "Minimum Phase Slow Roll-off" filter, wideband spectrum of white noise at –4dBFS (left channel red, right magenta) and 19.1kHz tone at 0dBFS (left blue, right cyan), with data sampled at 44.1kHz (20dB/vertical div.).
Fig.16 HiFi Rose RS520, digital input, "Corrected Minimum Phase Fast Roll-off" filter, wideband spectrum of white noise at –4dBFS (left channel red, right magenta) and 19.1kHz tone at 0dBFS (left blue, right cyan), with data sampled at 44.1kHz (20dB/vertical div.).
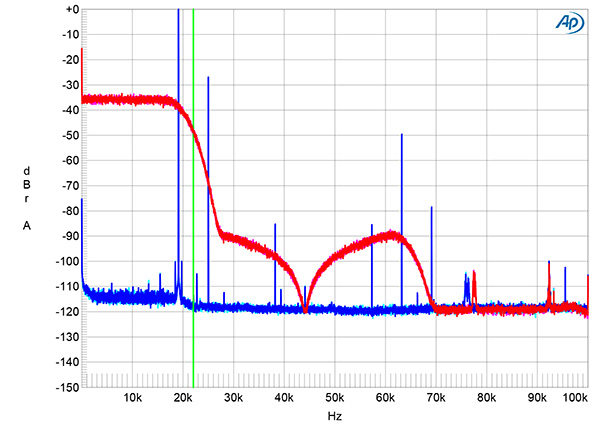
Fig.17 HiFi Rose RS520, digital input, "Slow Linear-Phase" and "Slow Minimum-Phase" filters, wideband spectrum of white noise at –4dBFS (left channel red, right magenta) and 19.1kHz tone at 0dBFS (left blue, right cyan), with data sampled at 44.1kHz (20dB/vertical div.).
With 44.1kHz-sampled white noise (fig.15, red and magenta traces), the RS520's "Minimum Phase Fast Roll-off" filter response starts to roll off above 20kHz but doesn't reach full stop-band suppression until 44.1kHz. Aliased images at 25kHz and 63.2kHz of a full-scale tone at 19.1kHz (blue and cyan traces) can be seen at –47dB, though the distortion harmonics of the 19.1kHz tone are all very low in level, at close to –80dB (0.01%). The "Linear Phase Fast Roll-off" filter behaved identically, but the "Corrected Minimum Phase Fast Roll-off," "Apodizing," and "Brickwall" filters all had a sharply defined null at half the sample rate (fig.16). The slow linear-phase and minimum-phase filters both rolled off slowly above the audioband, with a null at 44.1kHz (fig.17). With these two filters, the rolloff actually started slightly lower than the Nyquist frequency (half the sample rate). At 44.1kHz, for example, the rolloff started at 16kHz.
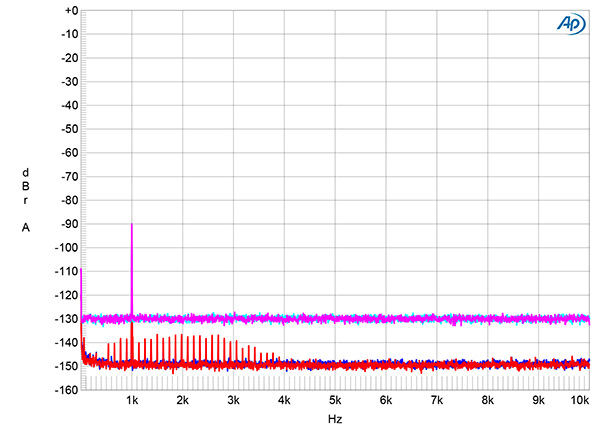

Fig.18 HiFi Rose RS520, digital input, spectrum with noise and spuriae of dithered 1kHz tone at –90dBFS with: 16-bit data (left channel cyan, right magenta), 24-bit data (left blue, right red) (20dB/vertical div.).
Fig.19 HiFi Rose RS520, digital input, waveform of undithered 16-bit, 1kHz sinewave at –90.31dBFS (left channel blue, right red).
Increasing the bit depth from 16 to 24 with a dithered 1kHz tone at –90dBFS lowered the noisefloor by 20dB (fig.18), meaning that the RS520's digital inputs offer between 19 and 20 bits' worth of resolution. With undithered data representing a tone at exactly –90.31dBFS (fig.19), the three DC voltage levels described by the data were well resolved, and the waveform was perfectly symmetrical (though overlaid with high-frequency noise).

Footnote 1: See, for example, fig.4 here.
Fig.20 HiFi Rose RS520, digital input, "Minimum Phase Slow Roll-off" filter. HF intermodulation spectrum, DC–30kHz, 19+20kHz at 0dBFS peak, sampled at 44.1kHz.
The second-order intermodulation product at 1kHz with an equal mix of 19 and 20kHz tones with a peak level of 0dBFS lay at a very low –100dB (0.001%, fig.20), and the higher-order products at 18kHz and 21kHz were almost 10dB lower in level. Though this graph was taken with a slow rolloff reconstruction filter, the aliased products at 24.1kHz and 25.1kHz are suppressed by more than 30dB.
Fig.21 HiFi Rose RS520, digital input, high-resolution jitter spectrum of analog output signal, 11.025kHz at –6dBFS, sampled at 44.1kHz with LSB toggled at 229Hz: 16-bit TosLink data (left channel blue, right red). Center frequency of trace, 11.025kHz; frequency range, ±3.5kHz.
The HiFi Rose's rejection of word-clock jitter with 16-bit data was identical with USB, Ethernet, and S/PDIF data. While the odd-order harmonics of the LSB-level, low-frequency squarewave were all at the correct levels, indicated by the sloping green line in fig.21, the spectral spike that represents the high-level tone at one-quarter the sample rate has relatively strong sidebands at ±578Hz, of unknown origin.
HiFi Rose's RS520 amplifier offers generally excellent measured performance, though its class-D output stage has a higher level of ultrasonic noise than I usually find with such designs.—John Atkinson
Footnote 1: See, for example, fig.4 here.


