Sidebar: 1991 Measurements Looking first at the performance of the KUBE, its distortion and input and output impedances measured to spec, while fig.1 shows its fundamental response with both contour controls set to their 12 o'clock positions. Note that the treble is shelved down by 1dB while the gentle, 2dB boost below 1kHz is presumably to compensate for the midrange driver's diffraction loss. The sharp rise in output level below 50Hz is to extend the speaker's bass below the bandpass enclosure frequency (where a slight, 2dB suckout compensates for what must be a slightly underdamped intrinsic tuning). 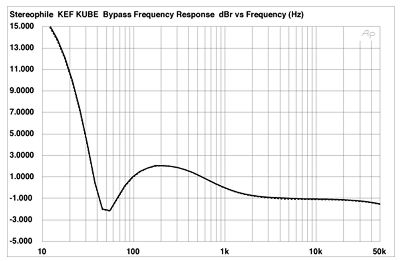 Fig.1 KEF R107/2 KUBE, frequency response with variable controls bypassed (2dB/vertical div.). Plotted with a slightly different vertical scale, fig.2 shows the KUBE's effect with both controls set to their maximum and minimum positions. The HF contour can be seen to boost or depress the speaker's output over an octave or so in the presence region, centered on 4.5kHz, while the action of the LF contour control is a little more complex, the position of the upper-bass peak changing with control position as well as the amount of low-frequency boost altering. Note that with the control set to maximum, there is almost 20dB of gain at 10Hz: the R107/2 owner is advised to use a turntable with low rumble and a well-matched arm/cartridge if his amplifier is not to spend most of its resources amplifying LF mud. Or do KEF owners just use CD sources in these days of analog twilight?
 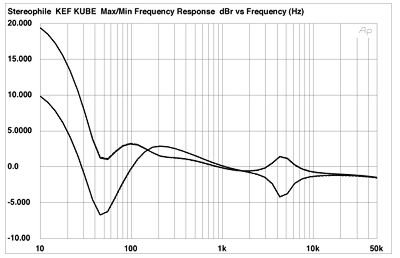 Fig.2 KEF R107/2 KUBE, frequency response with variable controls at maximum and minimum settings (5dB/vertical div.).
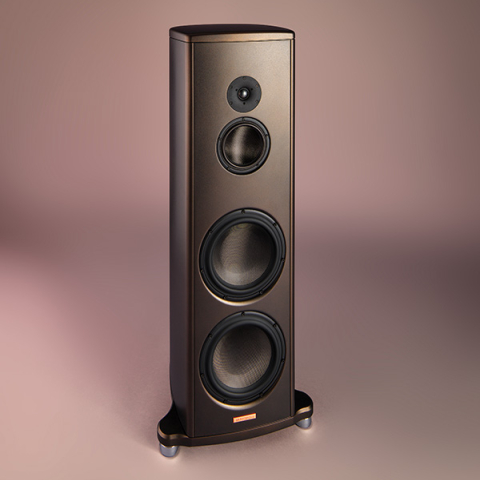
Turning to the R107/2, its impedance is shown in fig.3. The minimum value is 3.6 ohms at 940Hz. Note how uniform both impedance amplitude and phase are from 20Hz to 2kHz, the former varying less than half an ohm from the 4 ohm specification due to KEF's Conjugate Load crossover. Even moderately priced amplifiers, provided they have no trouble driving a 4 ohm resistive load, should be capable of raising high spls with the 107/2, particularly with a measured sensitivity (using a 1/3-octave warble tone centered on 1kHz) of 89dB at 1m with 2.83V input. (Note that the speaker's 4 ohm impedance means that it is drawing 2W from the amplifier at this drive voltage rather than 1W.)
Fig.2 KEF R107/2 KUBE, frequency response with variable controls at maximum and minimum settings (5dB/vertical div.).
Turning to the R107/2, its impedance is shown in fig.3. The minimum value is 3.6 ohms at 940Hz. Note how uniform both impedance amplitude and phase are from 20Hz to 2kHz, the former varying less than half an ohm from the 4 ohm specification due to KEF's Conjugate Load crossover. Even moderately priced amplifiers, provided they have no trouble driving a 4 ohm resistive load, should be capable of raising high spls with the 107/2, particularly with a measured sensitivity (using a 1/3-octave warble tone centered on 1kHz) of 89dB at 1m with 2.83V input. (Note that the speaker's 4 ohm impedance means that it is drawing 2W from the amplifier at this drive voltage rather than 1W.) 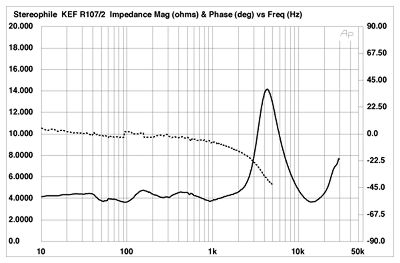 Fig.3 KEF R107/2, electrical impedance (solid) and phase (dashed, not valid above 2kHz). (2 ohms/vertical div.) Looking at the speaker's impulse response (fig.4), this was taken 44" away on the HF axis (ie, just above the reference axis) with the KUBE controls centered and with the speaker on a high stand to move the first boundary reflection (from the floor) a little farther back in time. This floor reflection can be seen just after the 7ms mark, but note also a couple of reflections about 1ms after the initial impulse. These could well be from the top edges of the woofer enclosure; looking at the Energy-Time Curve (not shown) reveals these reflections to be 25dB down in level, however. Other than that, there is very little to note from the impulse response other than a small amount of ultrasonic ringing from the tweeter, this well-damped in comparison with other metal-dome units, and a rather lazy decay of low-frequency energy from the high-order crossover filters employed. The step response is shown in fig.5.
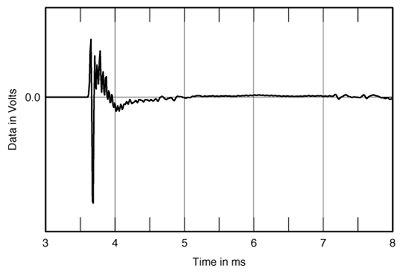 Fig.4 KEF R107/2, on-axis impulse response at 50" (5ms time window, 30kHz bandwidth).
 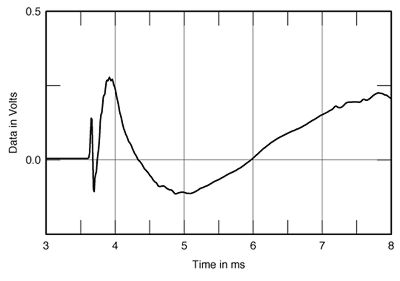 Fig.5 KEF R107/2, on-axis step response at 50" (5ms time window, 30kHz bandwidth). Transforming the impulse response to the frequency domain courtesy of Monsieur Fourier and averaging five such measurements on the HF axis across a 30 degrees horizontal window gives the quasi-anechoic response shown in fig.6. Commendably smooth, there is a slight lack of energy in the lower part of the tweeter's passband which might correlate with my feeling that the speaker's sound lacked immediacy with the KUBE's HF contour set to 12 o'clock. But a look at fig.7 shows the way in which the 107's response changes from directly on the HF axis to 30 degrees horizontally off that axis—not much! (The rearmost curve is a straight line because, rather than show the actual responses in this diagram, I have normalized them to the on-axis curve so that only the changes in response will appear.)
 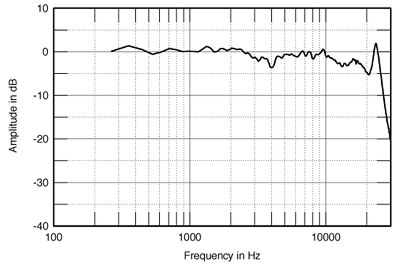 Fig.6 KEF R107/2, anechoic response on-axis at 44", averaged across 30 degrees horizontal window and corrected for microphone response (KUBE controls centered).
 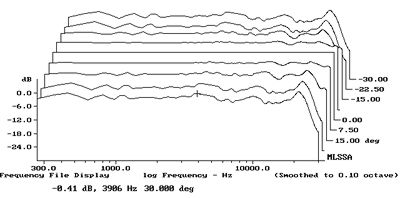 Fig.7 KEF R107/2, lateral response family at 44", normalized to response on tweeter axis, from back to front: differences in response 30-7.5 degrees off-axis, reference response, differences in response 7.5-30 degrees off-axis (KUBE controls centered).
With such a wide-dispersion design, it will be essential to keep the speakers away from sidewalls (or to arrange for those sidewalls to be diffractive) if the imaging is not to become smeared. Vertically, fig.8 shows the anechoic response 7.5 degrees above the HF axis (rear), on the midrange axis, and 7.5 degrees below the midrange axis (front), again all normalized to the response on the HF axis (straight line). You can see that above and below the preferred axis, notches develop at the crossover frequency, with that above being more severe, corresponding to a hollowness to the sound heard on pink noise on this axis. The listener should arrange to sit with his or her ears approximately level with the speakers' name badges to get the most neutral tonal balance. Note, however, that the response on the midrange driver axis is almost identical to that on the HF axis, suggesting that the optimum vertical window is not too critical.
Fig.7 KEF R107/2, lateral response family at 44", normalized to response on tweeter axis, from back to front: differences in response 30-7.5 degrees off-axis, reference response, differences in response 7.5-30 degrees off-axis (KUBE controls centered).
With such a wide-dispersion design, it will be essential to keep the speakers away from sidewalls (or to arrange for those sidewalls to be diffractive) if the imaging is not to become smeared. Vertically, fig.8 shows the anechoic response 7.5 degrees above the HF axis (rear), on the midrange axis, and 7.5 degrees below the midrange axis (front), again all normalized to the response on the HF axis (straight line). You can see that above and below the preferred axis, notches develop at the crossover frequency, with that above being more severe, corresponding to a hollowness to the sound heard on pink noise on this axis. The listener should arrange to sit with his or her ears approximately level with the speakers' name badges to get the most neutral tonal balance. Note, however, that the response on the midrange driver axis is almost identical to that on the HF axis, suggesting that the optimum vertical window is not too critical. 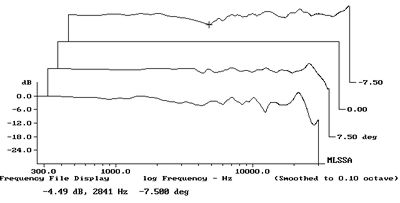 Fig.8 KEF R107/2, vertical response family at 44", normalized to response on tweeter axis, from back to front: difference in response 7.5 degrees above axis, reference response, differences in response 7.5 degrees-15 degrees below axis (KUBE controls centered). Next I looked at the individual responses of the bass bin (taken in the nearfield below 150Hz) and the midrange/treble head (taken again at 44" on the tweeter axis). These are shown in fig.9 with the respective levels arbitrarily plotted to agree with the specified 160Hz crossover frequency. Again, the midrange and treble are smooth, with a shallow but broad suckout in the presence region. In the bass, the more extended trace shows the response with the KUBE in circuit (with the LF contour set to 12 o'clock). This is ostensibly flat to 25Hz or so, gently rolling off below that frequency to -6dB at 19.5Hz. The other bass trace shows the woofer response with the KUBE transfer function subtracted from it by the MLSSA software. (Remember that the KUBE's bypass switch does not eliminate the low-frequency equalization.) The intrinsic woofer-port response can be seen to peak slightly at 48Hz and roll out at approximately 12dB/octave, much as if it were a sealed box.
 Fig.9 KEF R107/2, individual anechoic responses of head unit and bass bin at 44". The latter is plotted in the near field below 160Hz, with KUBE controls centered (extended trace) and out of circuit (less-extended trace). In-room, these quasi-anechoic measurements translate to a flat frequency balance, with excellent low-frequency extension, as shown in fig.10. This measurement, which I have found to correlate well with the perceived tonal balance of a speaker in my room, shows the 1/3-octave in-room response spatially averaged across a 6' by 2' window at the listening position to minimize the effect of room standing waves. No wonder the R107/2 sounds so smooth, so neutral!
  Fig.10 KEF R107/2, spatially averaged, 1/3-octave, free-field response in JA's listening room. Finally, the cumulative spectral decay plot for the anechoic part of the 107/2's impulse response (fig.11) shows a relatively clean decay, although there is a little more hash in the presence region than I would have expected. (The black ridge at 16kHz is due to the computer monitor's line scanning and should be ignored.) The small reflections I mentioned in my discussion of the speaker's impulse response (fig.4) manifest themselves in this plot as the time-axis ripples in the upper midrange, around the cursor position at 1240Hz. Their effect is hard to predict, however. Certainly they do not compromise the superb imaging results I heard with the Chesky Test CD.—John Atkinson
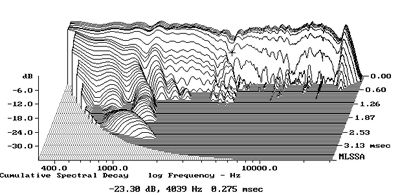 Fig.11 KEF R107/2, cumulative spectral-decay plot at 50" (0.15ms risetime).
Fig.1 KEF R107/2 KUBE, frequency response with variable controls bypassed (2dB/vertical div.). Plotted with a slightly different vertical scale, fig.2 shows the KUBE's effect with both controls set to their maximum and minimum positions. The HF contour can be seen to boost or depress the speaker's output over an octave or so in the presence region, centered on 4.5kHz, while the action of the LF contour control is a little more complex, the position of the upper-bass peak changing with control position as well as the amount of low-frequency boost altering. Note that with the control set to maximum, there is almost 20dB of gain at 10Hz: the R107/2 owner is advised to use a turntable with low rumble and a well-matched arm/cartridge if his amplifier is not to spend most of its resources amplifying LF mud. Or do KEF owners just use CD sources in these days of analog twilight? Fig.2 KEF R107/2 KUBE, frequency response with variable controls at maximum and minimum settings (5dB/vertical div.). Fig.3 KEF R107/2, electrical impedance (solid) and phase (dashed, not valid above 2kHz). (2 ohms/vertical div.) Looking at the speaker's impulse response (fig.4), this was taken 44" away on the HF axis (ie, just above the reference axis) with the KUBE controls centered and with the speaker on a high stand to move the first boundary reflection (from the floor) a little farther back in time. This floor reflection can be seen just after the 7ms mark, but note also a couple of reflections about 1ms after the initial impulse. These could well be from the top edges of the woofer enclosure; looking at the Energy-Time Curve (not shown) reveals these reflections to be 25dB down in level, however. Other than that, there is very little to note from the impulse response other than a small amount of ultrasonic ringing from the tweeter, this well-damped in comparison with other metal-dome units, and a rather lazy decay of low-frequency energy from the high-order crossover filters employed. The step response is shown in fig.5. Fig.4 KEF R107/2, on-axis impulse response at 50" (5ms time window, 30kHz bandwidth). Fig.5 KEF R107/2, on-axis step response at 50" (5ms time window, 30kHz bandwidth). Transforming the impulse response to the frequency domain courtesy of Monsieur Fourier and averaging five such measurements on the HF axis across a 30 degrees horizontal window gives the quasi-anechoic response shown in fig.6. Commendably smooth, there is a slight lack of energy in the lower part of the tweeter's passband which might correlate with my feeling that the speaker's sound lacked immediacy with the KUBE's HF contour set to 12 o'clock. But a look at fig.7 shows the way in which the 107's response changes from directly on the HF axis to 30 degrees horizontally off that axis—not much! (The rearmost curve is a straight line because, rather than show the actual responses in this diagram, I have normalized them to the on-axis curve so that only the changes in response will appear.) Fig.6 KEF R107/2, anechoic response on-axis at 44", averaged across 30 degrees horizontal window and corrected for microphone response (KUBE controls centered). Fig.7 KEF R107/2, lateral response family at 44", normalized to response on tweeter axis, from back to front: differences in response 30-7.5 degrees off-axis, reference response, differences in response 7.5-30 degrees off-axis (KUBE controls centered). Fig.8 KEF R107/2, vertical response family at 44", normalized to response on tweeter axis, from back to front: difference in response 7.5 degrees above axis, reference response, differences in response 7.5 degrees-15 degrees below axis (KUBE controls centered). Next I looked at the individual responses of the bass bin (taken in the nearfield below 150Hz) and the midrange/treble head (taken again at 44" on the tweeter axis). These are shown in fig.9 with the respective levels arbitrarily plotted to agree with the specified 160Hz crossover frequency. Again, the midrange and treble are smooth, with a shallow but broad suckout in the presence region. In the bass, the more extended trace shows the response with the KUBE in circuit (with the LF contour set to 12 o'clock). This is ostensibly flat to 25Hz or so, gently rolling off below that frequency to -6dB at 19.5Hz. The other bass trace shows the woofer response with the KUBE transfer function subtracted from it by the MLSSA software. (Remember that the KUBE's bypass switch does not eliminate the low-frequency equalization.) The intrinsic woofer-port response can be seen to peak slightly at 48Hz and roll out at approximately 12dB/octave, much as if it were a sealed box. Fig.9 KEF R107/2, individual anechoic responses of head unit and bass bin at 44". The latter is plotted in the near field below 160Hz, with KUBE controls centered (extended trace) and out of circuit (less-extended trace). In-room, these quasi-anechoic measurements translate to a flat frequency balance, with excellent low-frequency extension, as shown in fig.10. This measurement, which I have found to correlate well with the perceived tonal balance of a speaker in my room, shows the 1/3-octave in-room response spatially averaged across a 6' by 2' window at the listening position to minimize the effect of room standing waves. No wonder the R107/2 sounds so smooth, so neutral! Fig.10 KEF R107/2, spatially averaged, 1/3-octave, free-field response in JA's listening room. Finally, the cumulative spectral decay plot for the anechoic part of the 107/2's impulse response (fig.11) shows a relatively clean decay, although there is a little more hash in the presence region than I would have expected. (The black ridge at 16kHz is due to the computer monitor's line scanning and should be ignored.) The small reflections I mentioned in my discussion of the speaker's impulse response (fig.4) manifest themselves in this plot as the time-axis ripples in the upper midrange, around the cursor position at 1240Hz. Their effect is hard to predict, however. Certainly they do not compromise the superb imaging results I heard with the Chesky Test CD.—John Atkinson Fig.11 KEF R107/2, cumulative spectral-decay plot at 50" (0.15ms risetime).