Sidebar 4: Measurements
Because of the JBL 4367's size and weight, I drove my gear—DRA Labs' MLSSA system, an Earthworks microphone preamplifier, calibrated DPA 4006 and Earthworks QTC-40 microphones, and Dayton Audio's DATS V2 system—to AH's apartment for the measurements. While we were able to lift one of the speakers onto a short stack of 2 × 4s sitting on top of a dolly for the testing, the woofer was still relatively close to the floor. Reflections from the floor will therefore reduce the midrange resolution of the farfield response measurements. During these measurements, the speakers were driven by an Ayre Acoustics AX-5 Twenty amplifier. All measurements were made with the HF control in its center, neutral position.
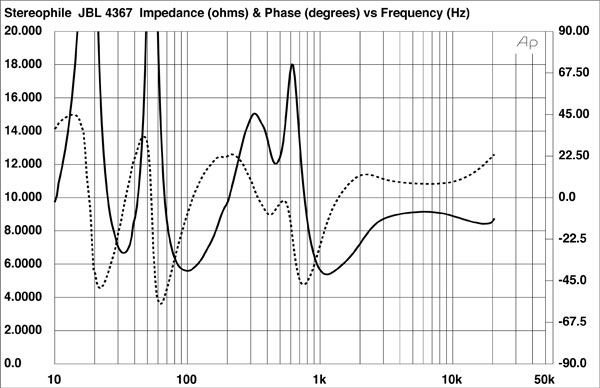
JBL specifies the 4367's sensitivity as 94dB/2.83V/m. My B-weighted estimate was slightly lower, at 92.7dB(B)/2.83V/m, but this is still a loudspeaker that will play at high levels with only a few watts. The JBL 4367's impedance is specified as 6 ohms. Measured with the DATS V2, the impedance magnitude (fig.1, solid trace) remained above 6 ohms for almost the entire audioband. The minimum magnitude was 5.6 ohms at 96Hz and 5.4 ohms between 1080Hz and 1180Hz. The electrical phase angle (dashed trace) is high in a couple of regions, however, and the equivalent peak dissipation resistance, or EPDR (footnote 1), drops to 2.5 ohms between 70Hz and 80Hz and 2.4 ohms between 885Hz and 950Hz. The JBL 4367 will work best with amplifiers that are not fazed by 4 ohm loads, but the need for current will be alleviated by the JBL's high sensitivity.
 The blue trace above 350Hz in fig.3 shows the woofer's farfield output, measured on the tweeter axis. It crosses over to the horn-loaded midrange/tweeter (green trace) close to the specified 700Hz with what appear to be symmetrical third-order filter slopes. Some response irregularities can be seen in the top two audio octaves, probably due to reflections of the horn-loaded tweeter's output from the mouth of the horn.
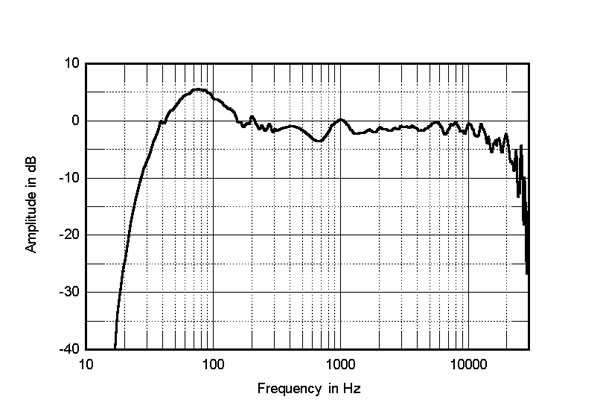
In fig.4, the black trace below 300Hz shows the complex sum of the nearfield woofer and port responses taking into account acoustic phase. The upper-bass boost in the loudspeaker's low frequencies will again be due to the nearfield measurement technique; the 4367's low frequencies appear tuned to be maximally flat, in textbook manner. Higher in frequency, in fig.4, the JBL's farfield response, averaged across a 30° horizontal window centered on the tweeter axis, is impressively even, except for a small dip and subsequent peak between 500Hz and 1kHz and the top-octave irregularities mentioned earlier.
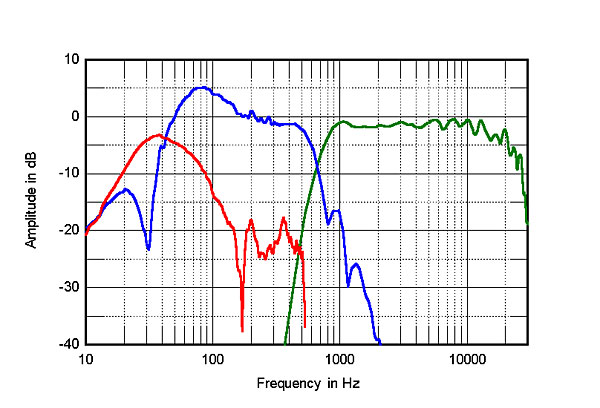
The blue trace above 350Hz in fig.3 shows the woofer's farfield output, measured on the tweeter axis. It crosses over to the horn-loaded midrange/tweeter (green trace) close to the specified 700Hz with what appear to be symmetrical third-order filter slopes. Some response irregularities can be seen in the top two audio octaves, probably due to reflections of the horn-loaded tweeter's output from the mouth of the horn.
In fig.4, the black trace below 300Hz shows the complex sum of the nearfield woofer and port responses taking into account acoustic phase. The upper-bass boost in the loudspeaker's low frequencies will again be due to the nearfield measurement technique; the 4367's low frequencies appear tuned to be maximally flat, in textbook manner. Higher in frequency, in fig.4, the JBL's farfield response, averaged across a 30° horizontal window centered on the tweeter axis, is impressively even, except for a small dip and subsequent peak between 500Hz and 1kHz and the top-octave irregularities mentioned earlier.
 The 4367's horizontal dispersion is shown in fig.5. (The traces are normalized to the response on the tweeter axis, which thus appears as a straight line.) Other than a slight lack of energy to the sides in the crossover region and some small peaks and dips in the top audio octave, the contour lines in this graph are smooth and even. The JBL's vertical dispersion, again normalized to the response on the tweeter axis, is shown in fig.6. The JBL 4367's tweeter axis is 32" from the floor, lower than the average ear height for seated listeners, which a 1990s survey for Stereophile indicated was 36". Fig.6 indicates that the response 5° above the tweeter axis is basically identical, so there should be no problem for seated listeners. Higher than that, however, a suckout starts to appear in the crossover region.
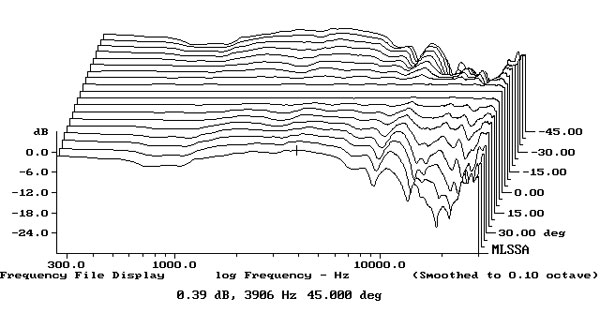
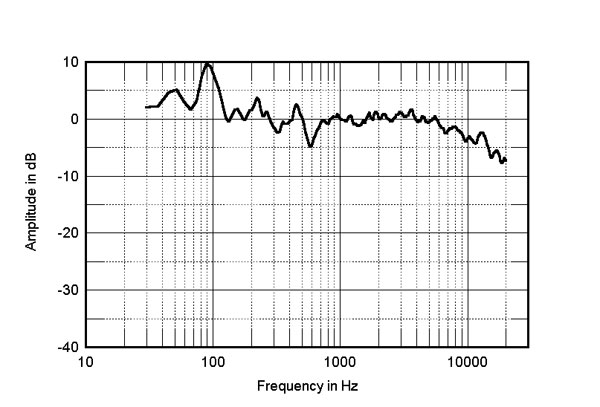
 Fig.7 shows the JBL 4367's spatially averaged response in AH's room. To generate this graph, I average 20 1/10-octave– smoothed responses taken individually for the left and right speakers in a vertical rectangular window centered on the position of the listener's ears. Averaging tends to minimize the effect of room resonances on the measured response below 400Hz. Other than a peak in the upper bass, which might have been due to the fact that the speakers were placed relatively close to the wall behind them, and a lack of energy just below the crossover region, the JBL's in-room response is impressively flat through the mid-treble region, above which the usual gentle slope down with increasing frequency is present.
Footnote 1: EPDR is the resistive load that gives rise to the same peak dissipation in an amplifier's output devices as the loudspeaker. See "Audio Power Amplifiers for Loudspeaker Loads," JAES, Vol.42 No.9, September 1994, and stereophile.com/reference/707heavy/index.html.
Fig.1 JBL 4367 Studio Monitor, electrical impedance (solid) and phase (dashed) (2 ohms/vertical div.).
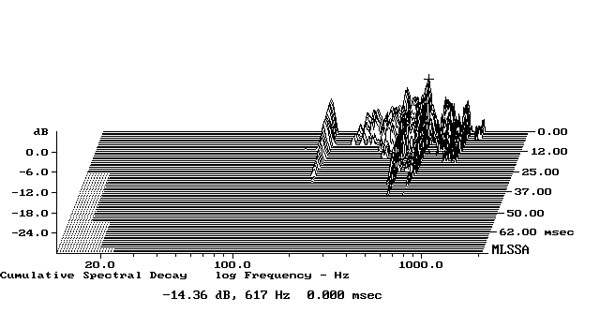
I investigated the enclosure's vibrational behavior with a plastic-tape accelerometer. Despite the large size of the panels, they were relatively quiet, and the only resonant modes were low in level. Fig.2 is a cumulative spectral-decay plot calculated from the accelerometer's output when it was fastened to the center of one of the sidewalls, level with the woofer. The highest-level mode, at 617Hz, is still low in absolute terms.
Fig.2 JBL 4367 Studio Monitor, cumulative spectral-decay plot calculated from output of accelerometer fastened to center of sidewall level with woofer (MLS driving voltage to speaker, 7.55V; measurement bandwidth, 2kHz).
The saddle centered on 31Hz in the impedance magnitude trace suggests that this is the tuning frequency of the twin ports on the front baffle, which implies extended low frequencies. The red trace in fig.3 shows the port's nearfield output. The response peaks a little higher than the tuning frequency, and while the upper-frequency rolloff is initially clean, some low-level peaks are visible in the midrange. The nearfield response of the woofer (fig.3, blue trace below 350Hz) has the expected notch at the ports' tuning frequency, which is when the back pressure from the port resonance holds the diaphragm stationary. The 5dB peak in the upper bass is due entirely to the nearfield measurement technique, which assumes the drive-unit is mounted in a true infinite baffle, ie, one that extends to infinity in both planes.
Fig.3 JBL 4367 Studio Monitor, acoustic crossover on tweeter axis at 50", corrected for microphone response, with the nearfield response of the port (red) and woofer (blue), respectively plotted below 525Hz and 350Hz.
Fig.4 JBL 4367 Studio Monitor, anechoic response on tweeter axis at 50", averaged across 30° horizontal window and corrected for microphone response, with the complex sum of the nearfield responses plotted below 300Hz.
Fig.5 JBL 4367 Studio Monitor, lateral response family at 50", normalized to response on tweeter axis, from back to front: differences in response 45–5° off axis, reference response, differences in response 5–45° off axis.
Fig.6 JBL 4367 Studio Monitor, vertical response family at 50", normalized to response on tweeter axis, from back to front: differences in response 15–5° above axis, reference response, differences in response 5–10° below axis.
Fig.7 JBL 4367 Studio Monitor, spatially averaged, 1/10-octave response in AH's listening room.
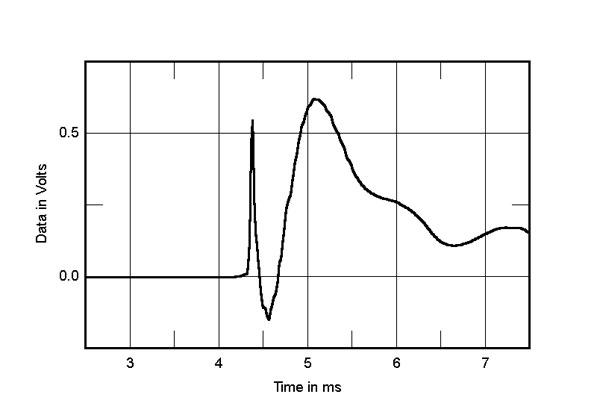
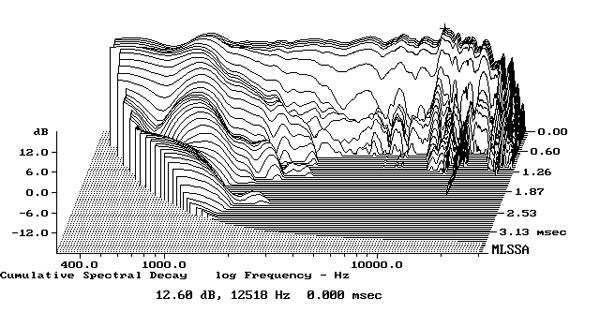
In the time domain, the JBL 4367's step response on the tweeter axis (fig.8) indicates that both drivers are connected in positive acoustic polarity and that the upper-frequency driver's output arrives first at the microphone. The decay of this unit's step smoothly blends with the start of the woofer's step, suggesting optimal crossover design. The ripples in the response after 5.5ms might be due to reflections of the woofer's output from the floor. The JBL's cumulative spectral-decay plot (fig.9) has a ridge of delayed energy around 1kHz. This graph is otherwise superbly clean in almost all of the region covered by the horn-loaded drive-unit.
Fig.8 JBL 4367 Studio Monitor, step response on tweeter axis at 50" (5ms time window, 30kHz bandwidth).
Fig.9 JBL 4367, Synthesis cumulative spectral-decay plot on tweeter axis at 50" (0.15ms risetime).
I wasn't sure what to expect from the 4367's measurements. My experience in the 1970s of high-sensitivity designs with horn-loaded drive-units led me to believe that too many compromises are needed to achieve such high sensitivity. No such compromises were made with the JBL 4367 Studio Monitor—it offers textbook measured performance.—John Atkinson
Footnote 1: EPDR is the resistive load that gives rise to the same peak dissipation in an amplifier's output devices as the loudspeaker. See "Audio Power Amplifiers for Loudspeaker Loads," JAES, Vol.42 No.9, September 1994, and stereophile.com/reference/707heavy/index.html.


