Sidebar 2: Measurements
The Exposure XVII's line-input impedance measured 7.6k ohms at 1kHz, a little less than the specified 10k ohms. This low value suggests that the XVII should be used with source components having as low an output impedance as possible. A value of a few tens of ohms is ideal, with a few hundred ohms a maximum practical value. The moving-magnet input impedance measured 47k ohms across the audio band. Moving-coil input impedance measured roughly 500 ohms at any audio frequency. (Exposure's spec sheet has a misprint in listing the MC input impedance at "470k ohms"; it should read "470 ohms.")
Voltage gain from line input to main out measured 22.7dB—a little on the high side for high-output digital sources, but not overly so. Gain from the moving-coil input to main output was a high 74.3dB. This is sufficient for even low-output moving-coil cartridges. Phono input overload (MM) was a very high 400mV at 1kHz, a far higher level than what any phono cartridge will produce, and equivalent to an extraordinary overload margin of 38.1dB. Line-input overload was greater than 12V RMS. These figures suggest that it's virtually impossible to overload the line or phono inputs.
Output impedance measured a very low 5 ohms from the main output—the XVII will drive any power-amp load with no trouble. Volume-control tracking was good, with a 0.4dB channel difference at 50mV output, 0.02dB at 250mV output, and less than 0.2dB error at 1V output and above. The volume control's unity gain position was at one o'clock. Maximum output voltage was a very high 16V RMS. Neither the line nor the phono stages invert polarity.
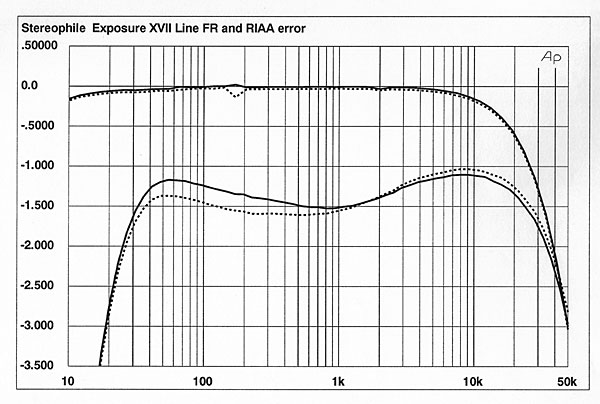
Line-stage frequency response and phono RIAA error are shown together in fig.1. The line stage rolls off by 0.6dB at 20kHz, with a –3dB point at just above 50kHz. RIAA accuracy was good, staying within half a dB of the reference 1kHz level between 30Hz and 20kHz. Note the bass rolloff built-in to prevent record warp from overdriving the power amplifier and woofers. This is typical of European phono-stage design. RIAA accuracy is independent of the phono board (MM or MC) installed in the XVII.
Footnote 1: A weighting curve applied to S/N measurements rolls off bass and treble to approximate the way we perceive the loudness of noise. The ear is less sensitive at high and low frequencies, making noise components at the frequency extremes less audible. The resultant "A-weighted" S/N ratio is a better indication of the noise's audibility than an unweighted measurement. Weighting curves are also used in sound-pressure–level measurements (wrongly, in JA's view, unless the source is noise rather than music).
Fig.1: Exposure XVII, line-stage frequency response (top) and phono-stage RIAA error (bottom) (right channel dashed, 0.5dB/vertical div.).
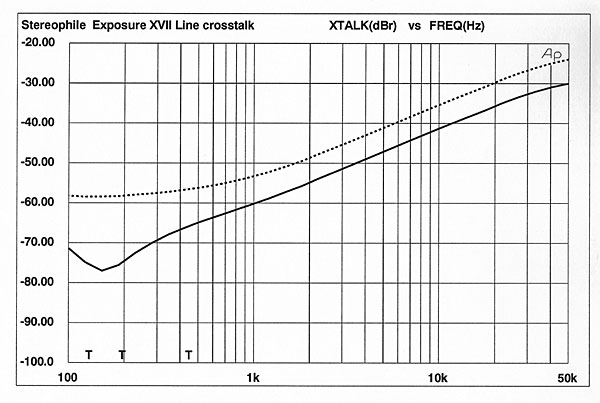
Line-stage crosstalk (fig.2) was moderate, measuring 53dB and 60dB at 1kHz in the left and right channels, respectively. The curve follows the classic 6dB/octave decrease in channel separation with frequency, which is indicative of capacitive coupling between channels. The 30dB of channel separation at 20kHz (right channel) is only fair.
Fig.2: Exposure XVII, line-stage crosstalk (from top to bottom): R–L; L–R (10dB/vertical div.).
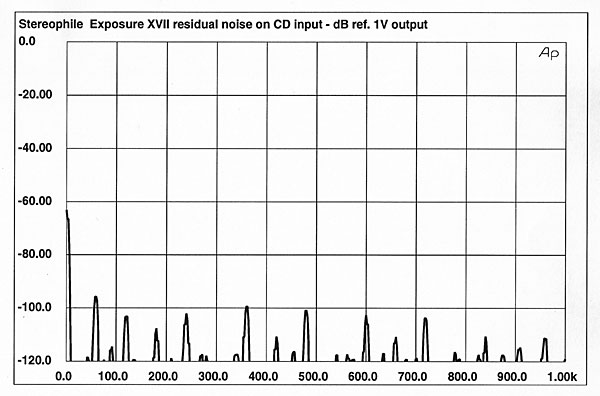
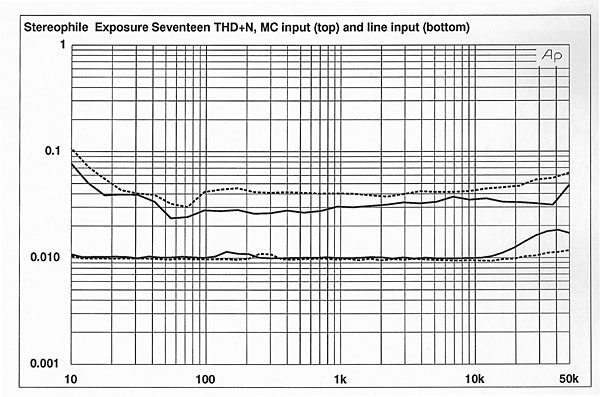
The XVII's measured S/N ratio was an excellent 84dB unweighted through the line stage, referenced to 1V output and measured over a 22Hz–22kHz bandwidth. The phono S/N ratio was 65dB, a figure that increased to 77dB when A-weighted (footnote 1). An FFT of the XVII's output with no signal applied and the volume control at unity gain produced the plot in fig.3. Some power-supply noise is apparent at 60Hz and its harmonics, but is well down in level (all components other than the first, which lies at –96dB, are at or below –100dB referenced to 1V output). Fig.4 is the XVII's THD+N vs frequency for both the line stage (bottom traces) and MC phono stage (top traces). The noise and distortion levels are quite low in level.
Fig.3 Exposure XVII, spectrum of residual line-stage noise ref. 1V, DC–1kHz (linear frequency scale, 20dB/vertical div.).
Fig.4: Exposure XVII, THD+noise vs frequency of phono stage (top) and line stage (bottom) (right channel dashed).
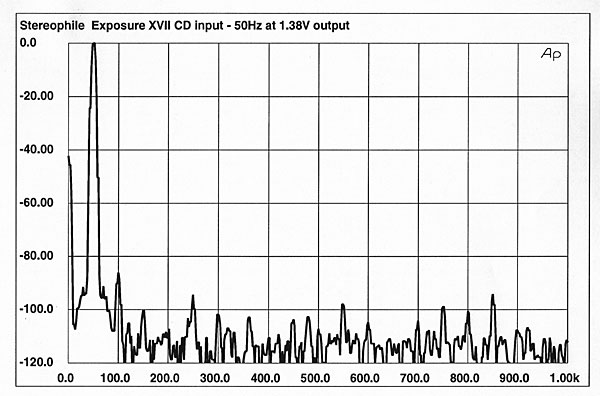
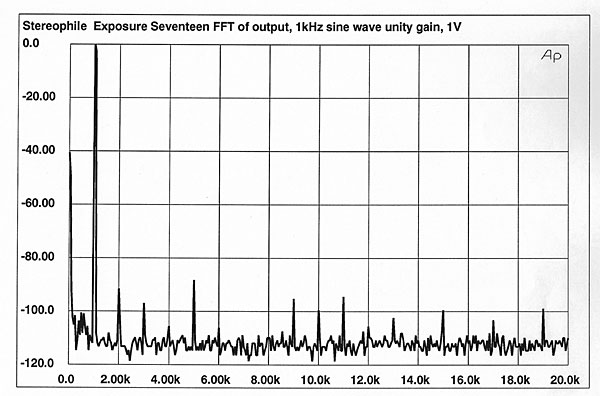
To examine the XVII's individual harmonic distortion components, I drove the XVII with first a 50Hz then a 1kHz sinewave at 1V RMS, set the volume control for unity gain, and performed an FFT analysis on the output. Fig.5 shows that at low frequencies the XVII's harmonic distortion is indeed low and consists primarily of the second harmonic at –86.1dB. The 3rd, 5th, 11th and 17th harmonics can be seen just above the –100dB level, however. At the higher frequency, the less sonically benign higher odd-order harmonics (5th, 9th, 10th, 11th, 13th) are higher in level. Although solid-state amplifiers do tend to produce odd-order harmonic distortion products, the XVII's distortion spectra showed more higher harmonics than is typical. Note that these harmonics are much more sonically objectionable than lower-order products. Listen to the examples of distortion products (tracks 21–24) on Stereophile's Test CD 2 to get an idea of what different distortion spectra sound like. Despite their very low level in absolute terms, the presence of these upper-order harmonic distortion components may tie in with the XVII's slightly metallic character in the mids and treble.—Robert Harley
Fig.5 Exposure XVII, spectrum of 50Hz sinewave at 1.38V into 100k ohms, DC–1kHz (linear frequency scale, 20dB/vertical div.).
Fig.6 Exposure XVII, spectrum of 1kHz sinewave at 1V into 100k ohms, DC–20kHz (linear frequency scale, 20dB/vertical div.).
Footnote 1: A weighting curve applied to S/N measurements rolls off bass and treble to approximate the way we perceive the loudness of noise. The ear is less sensitive at high and low frequencies, making noise components at the frequency extremes less audible. The resultant "A-weighted" S/N ratio is a better indication of the noise's audibility than an unweighted measurement. Weighting curves are also used in sound-pressure–level measurements (wrongly, in JA's view, unless the source is noise rather than music).