I measured the Engström Monica Mk3 with my Audio Precision SYS2722 system, checking some of the results with the magazine's top-line APx500. (I made sure that the inputs were set to Stereo, as indicated on the front-panel display.) The volume control appeared to operate in approximate 1.5dB steps at the top of its range and 1dB steps at lower settings. The maximum gain was 4.8dB at the balanced outputs for both the balanced and unbalanced inputs. The gain with the single-ended inputs at the single-ended outputs was –1.2dB, ie, 6dB lower, as specified. With its input toggle switches in the down position, the preamplifier preserved absolute polarity (ie, was noninverting) with both balanced and unbalanced inputs and outputs.
The Engström's balanced and unbalanced input impedances were 20k ohms at 1kHz and 20kHz, and inconsequentially lower at 12k ohms at 20Hz. At higher frequencies, the balanced output impedance was very low, at 36 ohms at 1kHz and 44 ohms at 20kHz. However, it rose to 300 ohms at 20Hz, presumably due to the use of an output transformer. The unbalanced output impedance was even lower, at 72 ohms at 20Hz, 14 ohms at 1kHz, and 18 ohms at 20kHz.
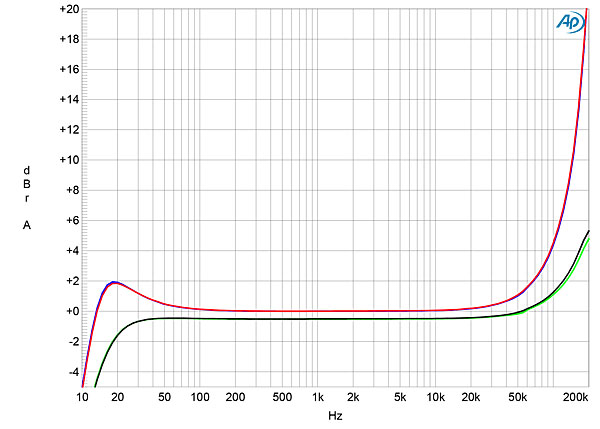
The Monica's frequency response, measured at the balanced outputs, is shown in fig.1. (Both the response and the excellent channel matching were identical with the single-ended inputs and outputs.) There is a small (+2dB) bump at the very bottom of the audioband into the high 100k ohm impedance (blue and red traces), but more puzzling is the rise in response above the audioband. This reached +4dB at 100kHz and +23.4dB at 204kHz, the highest frequency setting of the APx500's signal generator. This rise is very much lower with the low 600 ohm load (green and gray traces), and the low frequencies now start to roll off below 30Hz, but with the input impedance of 95k ohms that I measured for JVS's Dan D'Agostino Progression M550 amplifiers, the boosted ultrasonic response will be present—as will the boosted response at low frequencies. I am not sure what will be the consequences of the ultrasonic behavior, but the Engström preamplifier might be susceptible to picking up RF interference.
The Engström's channel separation was superb, at >120dB, L–R, and >110dB, R–L, below 5kHz. The Monica's wideband, unweighted signal/noise ratio, measured at the balanced outputs with the unbalanced inputs shorted to ground and the volume control set to its maximum, was a good 81.6dB in the left channel and 83.1dB in the right, both ratios ref. 2V output. Restricting the measurement bandwidth to the audioband increased the S/N ratio to 95dB, left, and 102dB, right, while switching in an A-weighting filter further improved these ratios to 107.9dB and 114.6dB, respectively. To check that the S/N ratios were not being affected by the control/power supply chassis on which it was sitting, I inserted a stack of 2 × 4s between the two and repeated the measurement. The ratios were identical.
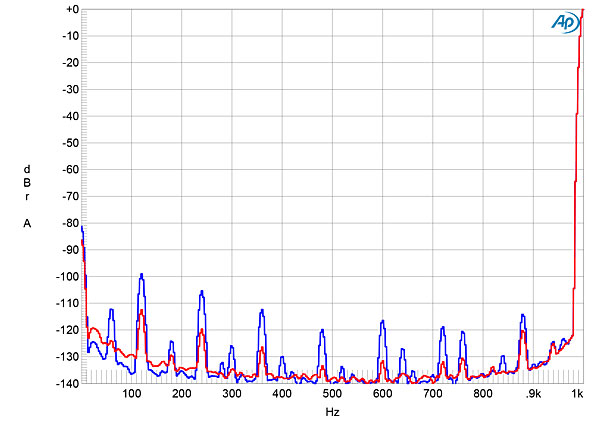
Fig.2 shows the preamplifier's low-frequency spectrum with the two chassis separated. The left channel's noisefloor (blue trace) has a higher level of supply-related spuriae than the right's (red), though the level of the random noisefloor is low in both channels. This graph was taken with the volume control set to its maximum; the spectrum was identical with the volume control set to –20dB, as it was when I connected a wire from the ground terminal on the power supply chassis to the analyzer's ground. The highest-level spuriae in the Monica's output lay at –100dB ref. 2V (0.001%), so I would not expect them to be audible. Nevertheless, I note that JVS found that with his sensitive Wilson speakers, "a slight hum was audible from the listening position."
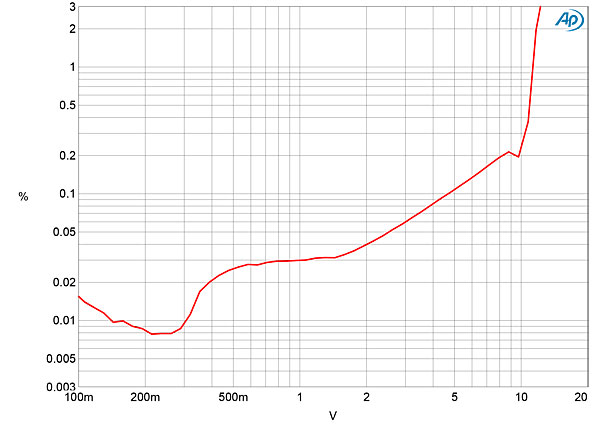
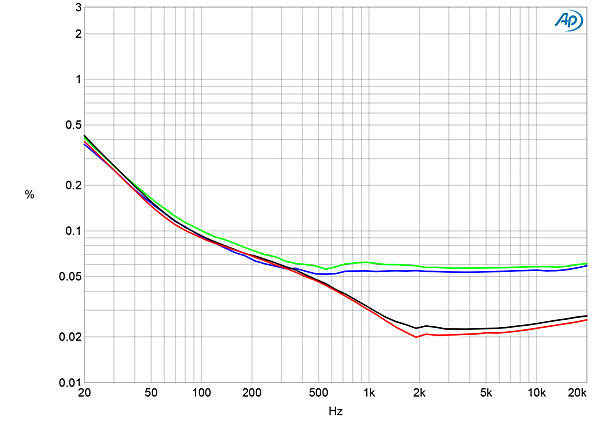
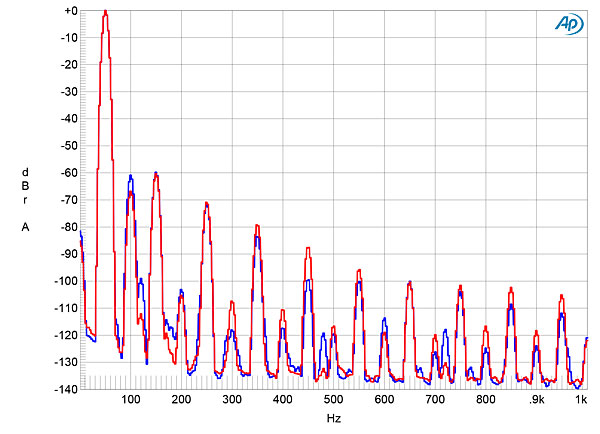
The THD+noise in the Monica's right-channel output reached 1%—our definition of clipping—at a high 11V into 100k ohms (fig.3), and the level of distortion below 2V was very low. This is commendable for a design that does not use negative feedback, especially as the clipping voltage into 600 ohms wasn't much lower than it was into 100k ohms. With the change of THD+N with frequency, I wasn't surprised to see that the percentage increased at low frequencies (fig.4). This will be due to the onset of core saturation in the Engtröm's output transformers. However, I was surprised to see that the distortion at higher frequencies was higher in the left channel (blue and green traces) than it was in the right channel (red and gray traces). This may well be due to the left channel's tubes not being as well-matched as the right channel's.
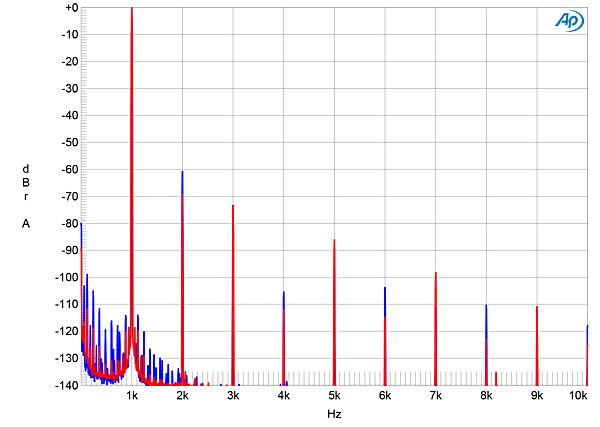
At low frequencies, the second and third harmonics were similar in level in both channels (fig.5), at close to –60dB (0.1%) each. At 1kHz (fig.6), the second harmonic was almost 10dB higher in the left channel (blue trace) than it was in the right, again suggesting that the tubes carrying the hot and cold signal phases were not as well-matched in that channel. (Perfectly matched balanced operation eliminates even-order harmonic distortion.) Higher-order harmonics were all very low in level in both channels.
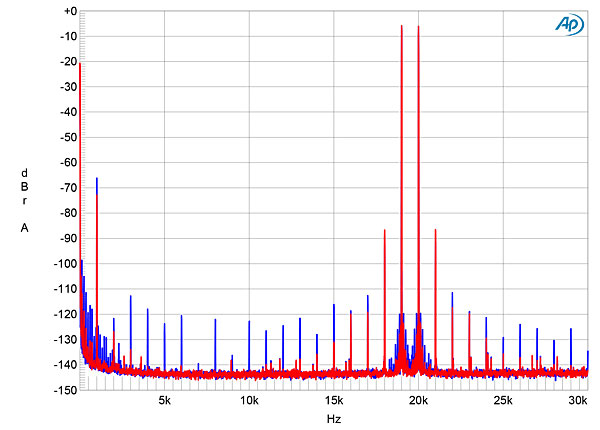
The fact that the Engström preamplifier's distortion signature predominantly comprises second and third harmonics works against it having audible consequences at the levels I found. However, this will only be true if the distortion signature doesn't result in excessive levels of intermodulation distortion. With an equal mix of 19kHz and 20kHz tones at a peak level of 2V into 100k ohms, the second-order product at 1kHz lay at –66dB (0.05%) in the left channel (fig.7, blue trace) and at –74dB in the right (0.02%, red trace). The higher-order products at 18kHz and 21kHz were at the same level in both channels, –87dB (0.004%), and while more high-order products were visible in the left channel's spectrum, these are all at a very low level. The picture didn't change when I repeated the spectral analysis with the punishing 600 ohm load.
The Engström Monica Mk3's measured performance is dominated by the designer's decision not to use negative feedback. The higher levels of noise and distortion in the left channel than the right may well have been due to that channel's tubes not being optimally matched, perhaps due to age. However, the levels of spuriae are still low in absolute terms. I was impressed by the fact that the preamplifier was not fazed by driving low impedances, but I remain puzzled by the boosted response at ultrasonic frequencies.—John Atkinson


