I measured a different sample of the CH Precision C10 from that auditioned by Jim Austin; mine had the serial number 0X651902. The power supply was the same one that he had used; its serial number was 0X651904. I carefully followed the instructions in the manual to connect the processor chassis to the external power supply with the four umbilical cables, one for each channel's analog circuitry and one for each channel's control circuitry. The umbilicals were long enough that I could keep the power supply chassis on the floor, well away from the processor.
I used my Audio Precision SYS2722 system for the measurements and used the five small buttons to the right of the front-panel display to access the setup menu. As JCA told me that he had performed his listening tests with the C10's balanced output level set to 5V and the feedback set to Local, I performed a complete set of tests with the C10 in that condition. I then repeated some of the tests with the two other output level settings and with the feedback set to Global.
The C10's coaxial and optical S/PDIF inputs and AES3 input accepted data sampled at all rates up to 192kHz. Apple's USB Prober app identified the C10 as "CH Precision USB Audio 2.0" from "CH Precision" and revealed that the USB port operated in the optimal isochronous asynchronous mode. Apple's AudioMIDI utility indicated that the C10 accepts 16- and 24-bit integer data via USB sampled at all rates from 44.1kHz to 384kHz. I connected the CH Precision's Ethernet port to my network, and the processor was recognized as a Roon Ready audio device by Roon. I used optical, USB, and network PCM data for the tests.
The C10's balanced output impedance was a low 54 ohms from 20Hz to 20kHz. The single-ended output impedance was half this value, as expected. The output impedance values were not affected when I set the feedback to Global. With the C10's maximum level set to 5V (balanced)/2.5V (unbalanced), the output with a full-scale 1kHz tone was the specified 5V, balanced, and 2.48V, unbalanced. Setting the maximum level to 10V (balanced)/5V (unbalanced) gave outputs of 10V and 5V, respectively. Setting the output to 2V (balanced)/1V (unbalanced) gave maximum levels of 2V and 1V. With the Polarity set to In-Phase, both output types preserved absolute polarity, ie, were noninverting, with all three level settings.
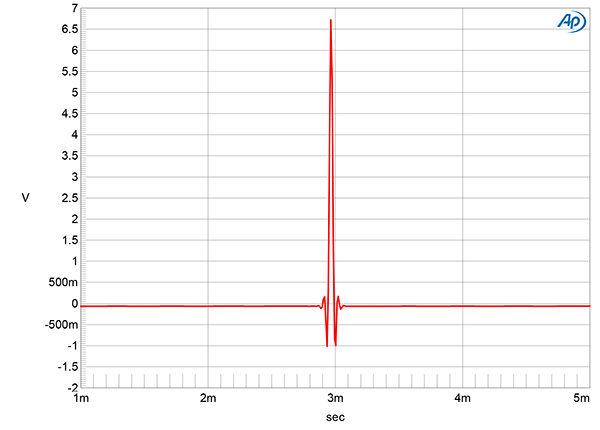
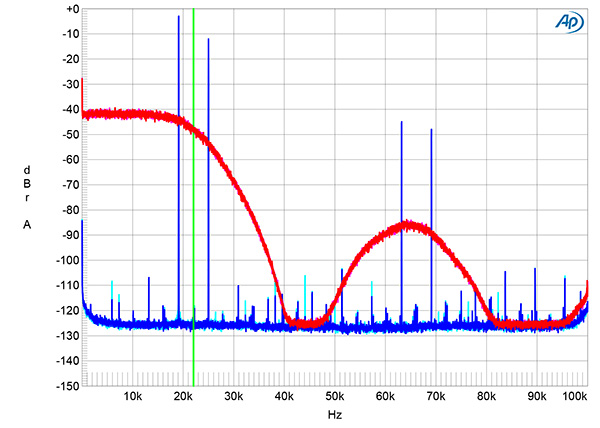
Fig.1 indicates that the C10's reconstruction filter is an extremely short, linear-phase type, with just one cycle of ringing on either side of the single sample at 0dBFS. However, it is possible that the ringing is due to the antialiasing filter used with the Audio Precision's A/D converter, which was operating with a sample rate of 200kHz; if so, then the CH Precision's impulse response is close to a perfect delta function. This kind of time domain–optimized filter is associated with a very slow low-pass function, which can be seen with the magenta and red traces in fig.2, taken with 16-bit white noise at –4dBFS sampled at 44.1kHz. The output doesn't reach full stop-band attenuation until an octave above the audioband. With a full-scale tone at 19.1kHz (blue and cyan traces), an aliased image at 25kHz lies at –12dB, and other high-level aliased images can be seen between 60kHz and 70kHz. Distortion harmonics of the 19.1kHz tone were extremely low in level, however.
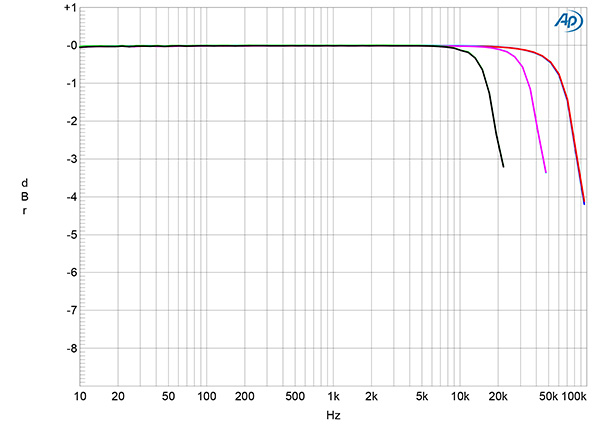
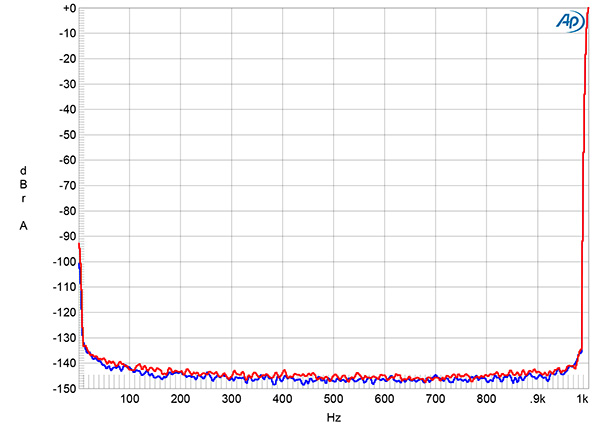
With 44.1kHz data, the C10's output was down by 2.5dB at 20kHz (fig.3, green and gray traces). The responses with data sampled at 96kHz (cyan, magenta traces) and 192kHz (blue, red traces) followed the same basic shape but with the low-pass rolloff proportionally higher in frequency. Neither the frequency responses nor the superb channel matching were different at the other two output level settings. As anticipated from the dual-mono construction, channel separation (not shown) was at the limit of the Audio Precision's resolution, at >125dB in both directions below 1kHz. The low-frequency noisefloor, assessed with 24-bit data representing a full-scale 1kHz tone, was very clean (fig.4), with no power supply–related spuriae present. The level of the noisefloor was identical referred to all three maximum output level voltages.
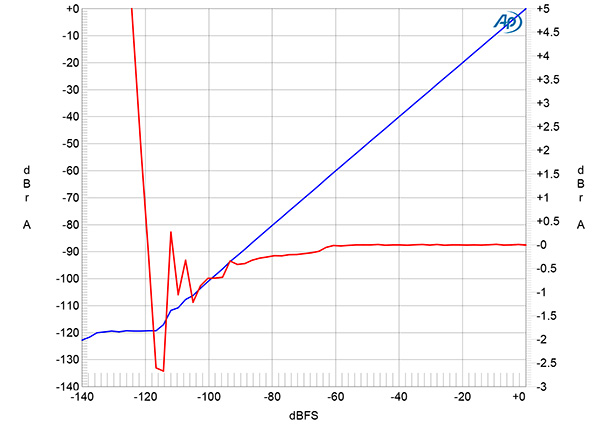
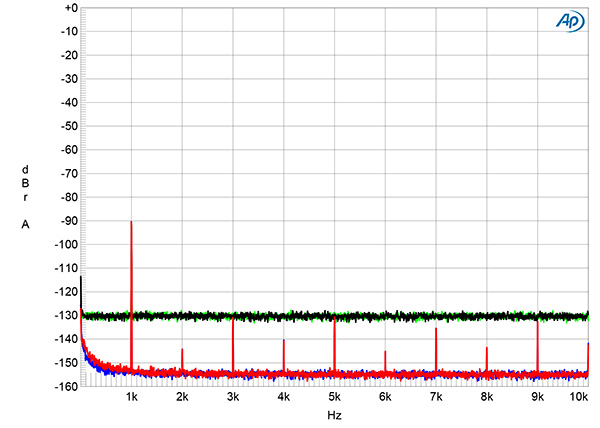
The red trace in fig.5 plots the error in the balanced output level as a 24-bit, 1kHz digital tone steps down from 0dBFS to –140dBFS. (This graph was taken with the left channel's output; the right channel behaved very similarly.) The amplitude error starts to increase below –80dBFS and rises significantly below –116dBFS. Fig.6 shows the C10's balanced output spectrum with a dithered 1kHz tone at –90dBFS with 16-bit data (green and gray traces) and with 24-bit data (blue and red traces). With 16-bit data, the noisefloor is that of the dither; with 24-bit data the noisefloor drops by around 24dB, which suggests a high measured resolution of 21 bits and is at odds with what is shown in fig.5. However, a regular series of harmonics is present with the 24-bit data, with the odd-order harmonics the highest in level. This behavior implies that one or two of the lowest significant bits are being truncated, hence the rise in linearity error below –116dBFS in fig.5. The presence of even-order harmonics in the 24-bit spectrum might be due to the low-level linearity of the paralleled PCM1704 R2R ladder-DAC chips not being perfectly matched.
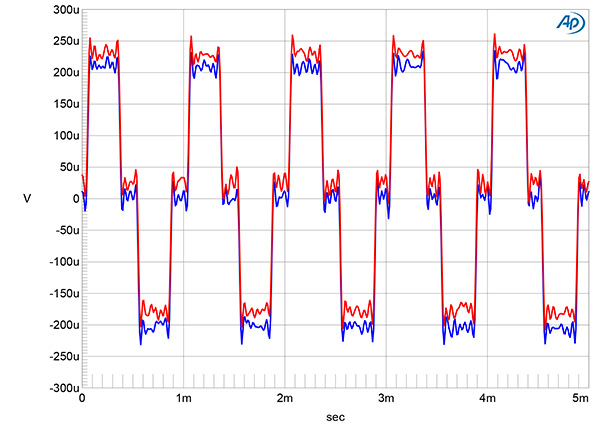
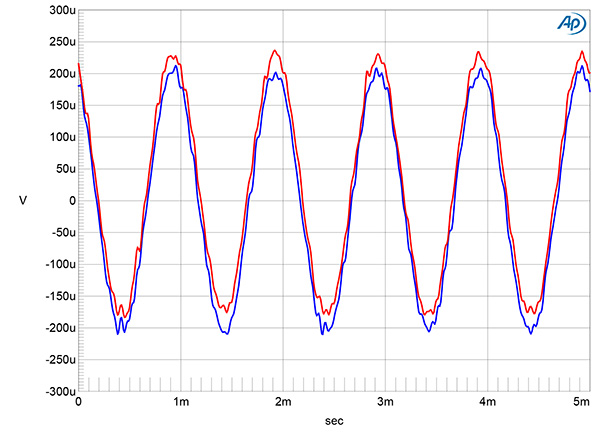
With undithered 16-bit data at exactly –90.31dBFS, the three DC voltage levels described by the data were well resolved (fig.7; footnote 1). High-frequency noise is extremely low in level, and with undithered 24-bit data at the same level, the result was a well-formed sinewave (fig.8).
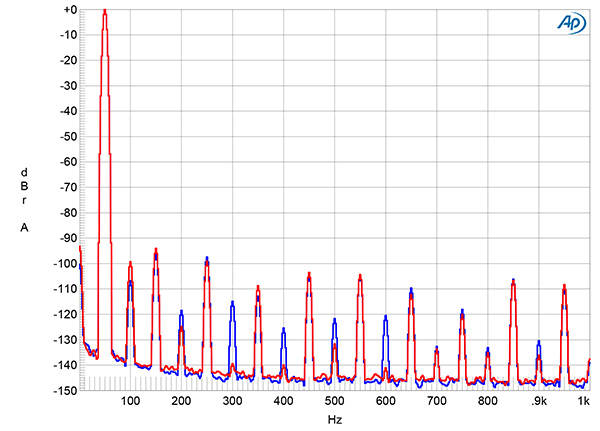
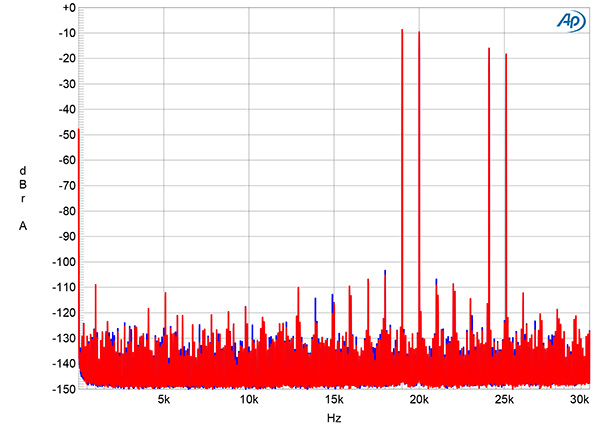
The C10 offered very low levels of harmonic distortion, with the third and fifth harmonics the highest in level just above –100dB (0.001%, fig.9). Though other harmonics are present, these all lie at even lower levels. This graph was taken with the feedback set to Local; repeating the spectral analysis with it set to Global didn't change the levels of the odd-order harmonics, but the level of the second harmonic dropped by 6dB. Commendably, these harmonics didn't increase in level when I reduced the load to 600 ohms. Fig.10 plots the spectrum of the C10's balanced output with an equal mix of 19kHz and 20kHz tones, the 24-bit signal peaking at 0dBFS. Feedback was set to Local. The use of a slow-rolloff reconstruction filter results in high-level aliased images of the tones at 24.1kHz and 25.1kHz, but actual intermodulation products are very low in level. The second-order difference product lies at just –110dB (0.0003%). Setting feedback to Global reduced the level of this product by 6dB.
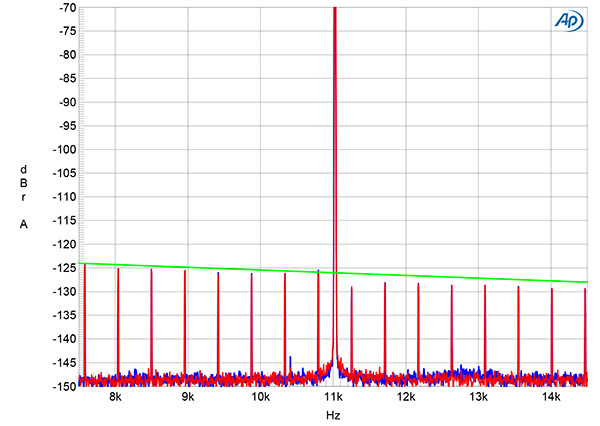
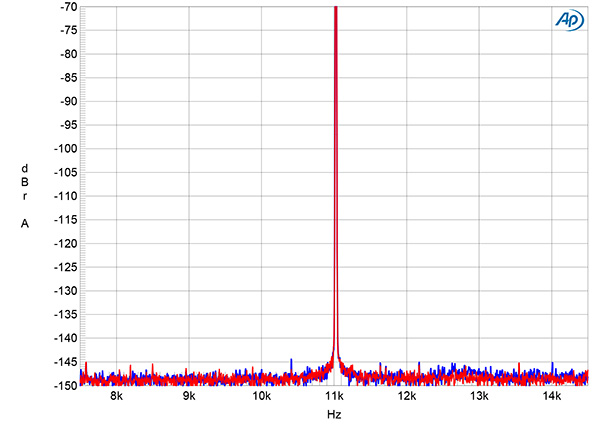
I tested the CH Precision's rejection of word-clock jitter with 16-bit, undithered J-Test data using the TosLink and network inputs. Other than those just above the Fs/4 spectral spike, the odd-order harmonics of the LSB-level, low-frequency squarewave are very close to the correct levels (fig.11, sloping green line), and no other sidebands are present. With 24-bit J-Test data (fig.12), the random noisefloor lay at a very low –147dB.
The CH Precision C10's measured performance is very similar to that of the CH Precision C1.2 that Jim Austin reviewed in February 2023. Like the C1.2, the C10's behavior is dominated by its use of a reconstruction filter optimized for time-domain performance with its very slow ultrasonic rolloff.—John Atkinson
Footnote 1: I was recently asked what this test means. In the twos-complement encoding used by 16-bit digital audio, –1 least significant bit (LSB) is represented by 1111 1111 1111 1111, digital zero by 0000 0000 0000 0000, and +1 LSB by 0000 0000 0000 0001. If the undithered waveform is symmetrical, this indicates that changing all 16 bits in the digital word gives exactly the same change in the analog output level as changing just the LSB.


