Sidebar 3: Measurements
I measured the CH Precision C1.2 with my Audio Precision SYS2722 system, repeating some measurements with the higher-performance APx500. The external power supply and clock weren't available for the testing. The C1.2's coaxial and optical S/PDIF inputs and AES3 input accepted data sampled at all rates up to 192kHz. Apple's AudioMIDI utility revealed that the C1.2 accepted 16- and 24-bit integer data via USB sampled at all rates from 44.1kHz to 384kHz. Apple's USB Prober app identified the C1.2 as "CH Precision USB Audio 2.0" from "CH Precision" and indicated that the USB port operated in the optimal isochronous asynchronous mode.
The C1.2's output impedance was a usefully low 64 ohms, balanced, 73 ohms, RCA unbalanced, and 49 ohms, unbalanced BNC, all values consistent from 20Hz to 20kHz. With the C1.2's gain set to its maximum, the output level with a full-scale 1kHz tone was the specified 5.1V for the balanced output—0.5dB lower than that of the C1.2's predecessor, the C1—and 2.54V for both types of unbalanced output. Reducing the maximum gain by an indicated 12dB reduced the output level by exactly 12dB.
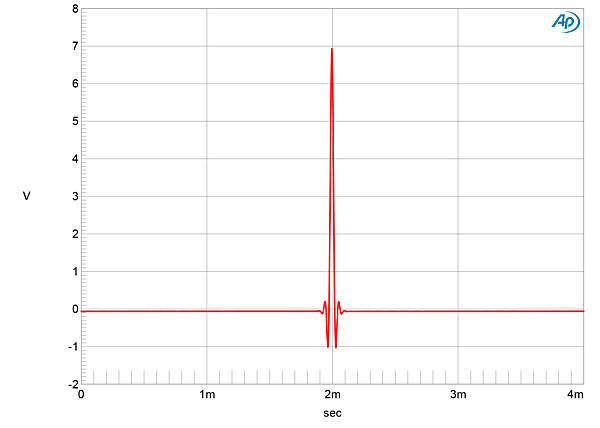
All the outputs preserved absolute polarity, which can be seen in fig.1. This graph indicates that the C1.2's reconstruction filter is a very short, linear-phase type, with just one cycle of ringing on either side of the single high sample. This type of time domain–optimized filter is associated with a very slow low-pass function, which can be seen with the magenta and red traces in fig.2, taken with 16-bit white noise at –4dBFS. The output doesn't reach full stop-band attenuation until an octave above the audioband! With a full-scale tone at 19.1kHz (blue and cyan traces), an aliased image at 25kHz lies at –12dB and other aliased images can be seen between 60kHz and 70kHz. Distortion harmonics of the 19.1kHz tone are extremely low in level, however, with the third lying at just –97dB (0.0014%).

Footnote 1: For an example of excellent low-level ladder-DAC linearity, see figs.11 & 12 here.
Fig.1 CH Precision C1.2, impulse response (one sample at 0dBFS, 44.1kHz sampling, 4ms time window).
Fig.2 CH Precision C1.2, wideband spectrum of white noise at –4dBFS (left channel red, right magenta) and 19.1kHz tone at 0dBFS (left blue, right cyan), with data sampled at 44.1kHz (20dB/vertical div.).
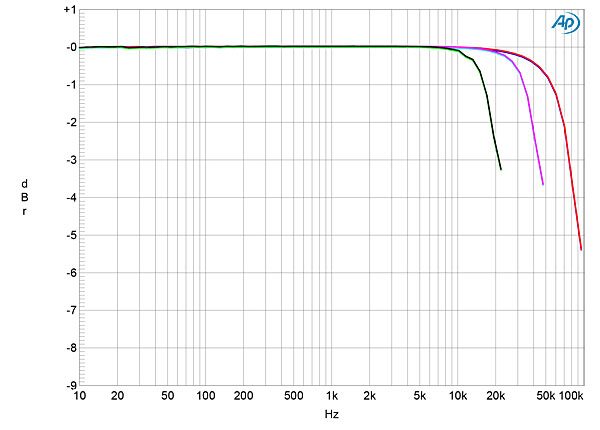
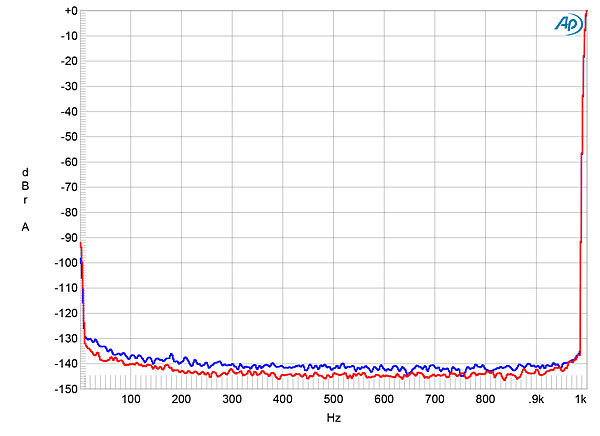
With 44.1kHz data, the C1.2's output was down by 3dB at 20kHz (fig.3, green and gray traces), which is typical of a B-spline–based reconstruction filter. The responses with data sampled at 96kHz and 192kHz followed the same basic shape, but with the –3dB frequency proportionally higher. Neither the frequency responses nor the superb channel matching changed at lower volume-control settings. Channel separation (not shown) was also superb, at >120dB in both directions below 3kHz and still 113dB at the top of the audioband. The low-frequency noisefloor (fig.4) was very clean, with no power supply–related spuriae present.
Fig.3 CH Precision C1.2, frequency response at –12dBFS into 100k ohms with data sampled at: 44.1kHz (left channel green, right gray), 96kHz (left cyan, right magenta), and 192kHz (left blue, right red) (1dB/vertical div.).
Fig.4 CH Precision C1.2, spectrum of 1kHz sinewave, DC–1kHz, at 0dBFS (left channel blue, right red; linear frequency scale).
Fig.5 shows the C1.2's balanced output spectrum with a dithered 1kHz tone at –90dBFS with 16-bit data (green and gray traces) and with 24-bit data (blue and red traces). With the 16-bit data the noisefloor is that of the dither; with 24-bit data the noisefloor drops by around 20dB, which suggests a high resolution between 19 and 20 bits. However, a regular series of harmonics is present with the 24-bit data, with the odd-order harmonics the highest in level. (The unbalanced outputs behaved identically, other than with lower levels of the even-order harmonics.) This behavior implies that the lowest significant bit is being truncated. With undithered 16-bit data at exactly –90.31dBFS, the three DC voltage levels described by the data are well resolved (fig.6), and high-frequency noise is extremely low in level. With undithered 24-bit data at the same level, the result was a well-formed sinewave (fig.7).
Fig.5 CH Precision C1.2, spectrum with noise and spuriae of dithered 1kHz tone at –90dBFS with: 16-bit data (left channel green, right gray), 24-bit data (left blue, right red) (20dB/vertical div.).
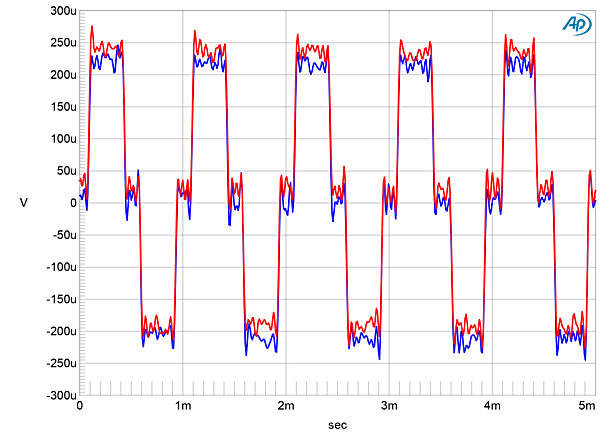
Fig.6 CH Precision C1.2, waveform of undithered 16-bit, 1kHz sinewave at –90.31dBFS (left channel blue, right red).
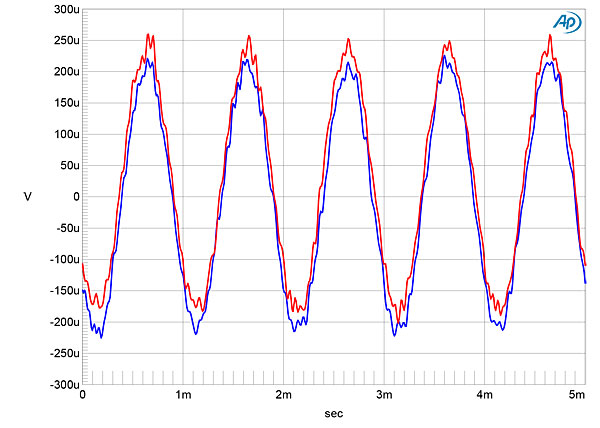
Fig.7 CH Precision C1.2, waveform of undithered 24-bit, 1kHz sinewave at –90.31dBFS (left channel blue, right red).
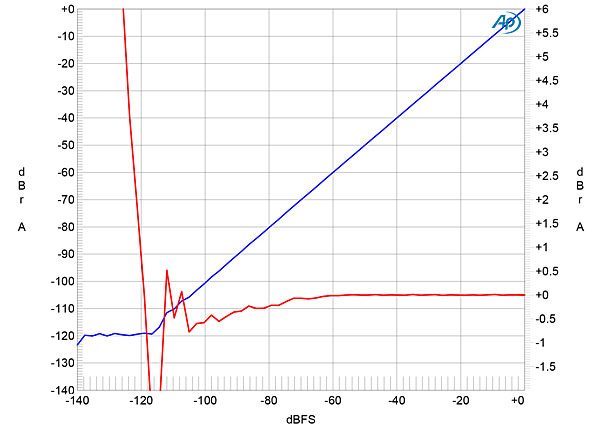
The red trace in fig.8 plots the error in the balanced output level as a 24-bit, 1kHz digital tone steps down from 0dBFS to –140dBFS. (This graph was taken with the left channel's output; the right channel behaved identically.) The amplitude error starts to increase below –80dBFS, which is associated with the harmonic distortion seen in fig.5. I understand that the C1.2 uses parallel pairs of PCM1704 DAC chips; the behavior in figs.5 and 8 might be due to the DAC pairs not being perfectly matched in low-level linearity. (Achieving good low-level linearity with R-2R ladder DACs is always difficult (footnote 1), which is why many designs use sigma-delta chips where this is not an issue.)
Fig.8 CH Precision C1.2, left channel, 1kHz output level vs 24-bit data level in dBFS (blue, 10dB/vertical div.); linearity error (red, 0.5dB/small vertical div.).
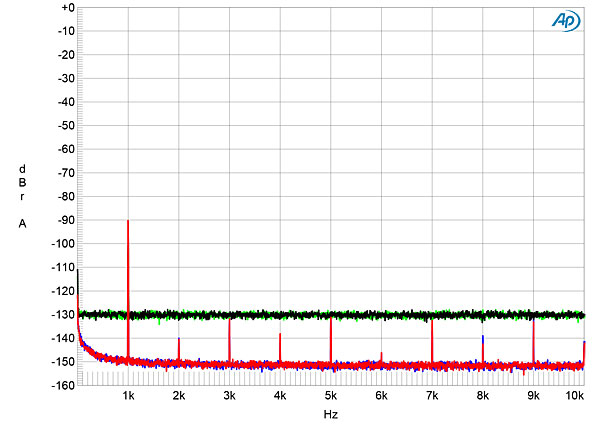
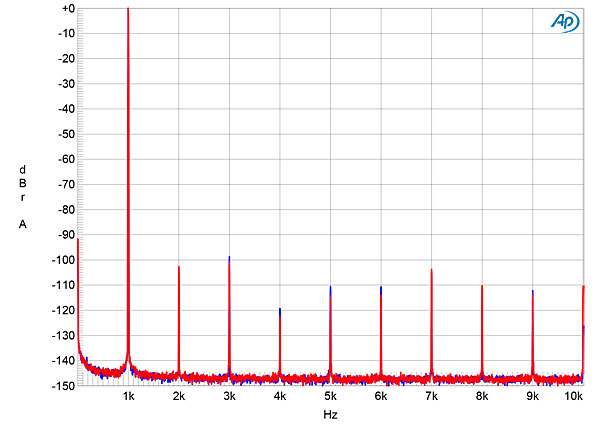
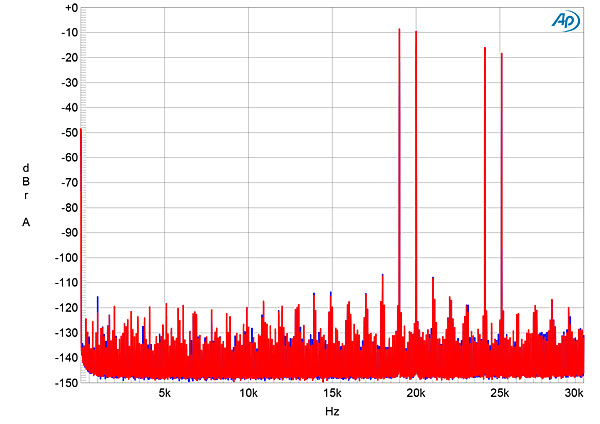
The C1.2 offered very low levels of harmonic distortion, with the third harmonic the highest in level at –100dB (0.001%, fig.9). Though other harmonics are present, these all lie at lower levels. These harmonics didn't increase in level when I reduced the load to 600 ohms, but the low-order harmonics decreased slightly in level when I reduced the signal level by 3dB. Fig.10 plots the spectrum of the C1.2's balanced output with an equal mix of 19kHz and 20kHz tones, the 24-bit signal peaking at 0dBFS. The use of a slow-rolloff reconstruction filter results in high-level aliased images of the tones at 24.1kHz and 25.1kHz, but actual intermodulation products are very low in level.
Fig.9 CH Precision C1.2, spectrum of 1kHz sinewave, 24-bit data, at 0dBFS, DC–10kHz, into 100k ohms (left channel blue, right red; linear frequency scale).
Fig.10 CH Precision C1.2, HF intermodulation spectrum (DC–30kHz), 19+20kHz, 24-bit data, at 0dBFS into 100k ohms (left channel blue, right red; linear frequency scale).
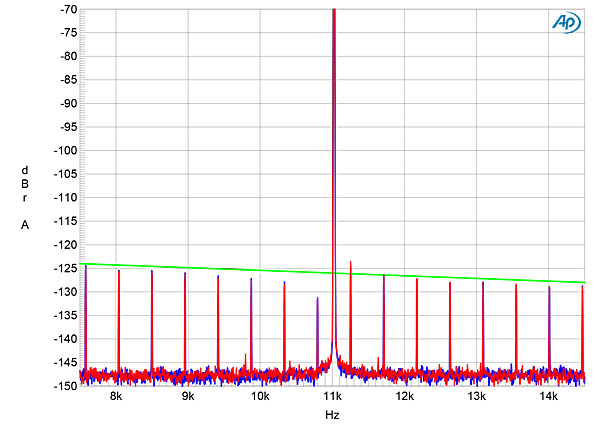
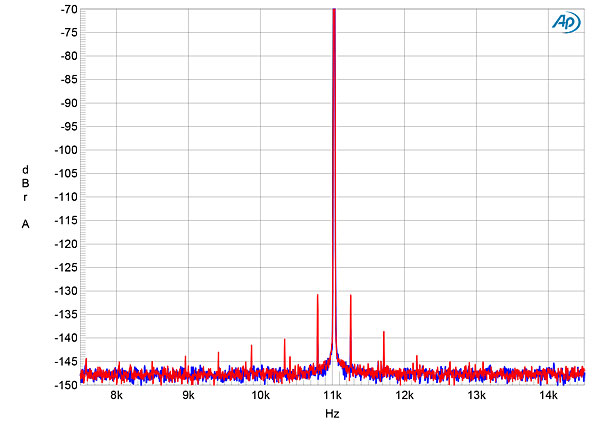
Finally, I tested the CH Precision's rejection of word-clock jitter with 16-bit, undithered J-Test AES3 and TosLink data. Other than those closest to the Fs/4 spectral spike, the odd-order harmonics of the LSB-level, low-frequency squarewave are very close to the correct levels (fig.11, sloping green line), and no other sidebands are present. With 24-bit J-Test data (fig.12), a single pair of sidebands was still present at ±229.6875Hz, but the random noisefloor lay at a very low –147dB.
Fig.11 CH Precision C1.2, high-resolution jitter spectrum of analog output signal, 11.025kHz at –6dBFS, sampled at 44.1kHz with LSB toggled at 229.6875Hz: 16-bit undithered AES3 data (left channel blue, right red). Center frequency of trace, 11.025kHz; frequency range, ±3.5kHz.
Fig.12 CH Precision C1.2, high-resolution jitter spectrum of analog output signal, 11.025kHz at –6dBFS, sampled at 44.1kHz with LSB toggled at 229.6875Hz: 24-bit undithered AES3 data (left channel blue, right red). Center frequency of trace, 11.025kHz; frequency range, ±3.5kHz.
Other than the possible truncation of the 24th LSB and the mismatch of the DAC chips' low-level linearity, both of which were present with the earlier C1, the CH Precision C1.2 offers generally excellent measured performance. The C1.2's behavior is dominated by its use of a reconstruction filter optimized for time-domain performance, with its very slow ultrasonic rolloff.—John Atkinson
Footnote 1: For an example of excellent low-level ladder-DAC linearity, see figs.11 & 12 here.


