From the outside, the Audio Research Reference 6SE looks identical to the Reference 6 preamplifier that Michael Fremer reviewed in December 2016. I measured the REF 6SE's performance with my Audio Precision SYS2722 system (see the January 2008 "As We See It"). Like the earlier preamplifier, the REF 6SE's volume control operates in approximately 0.3dB steps. The gain with the volume control set to its maximum—"103" on the front-panel display—was 12.2dB, balanced or unbalanced input to balanced output, and 6.1dB, unbalanced input to unbalanced output. The unity-gain setting was "62." Both sets of inputs and outputs preserved absolute polarity (ie, were noninverting). The unbalanced input impedance was 41k ohms at 20Hz and 1kHz, dropping slightly to a still high 34k ohms at 20kHz. As usual, the balanced input impedances were twice the unbalanced values.
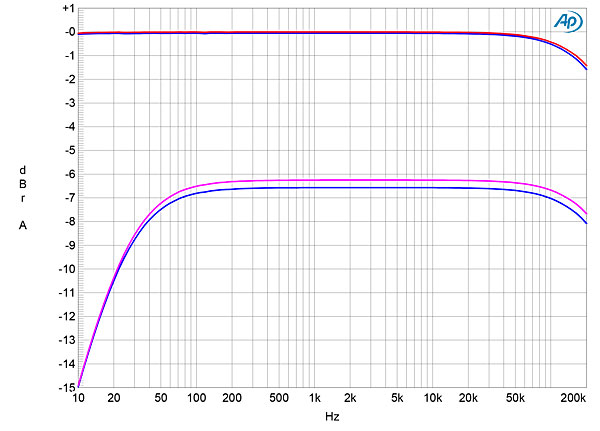
The unbalanced output impedance was 308 ohms at 1kHz and 20kHz, rising to 592 ohms at 20Hz. The balanced output impedance was 669 ohms at 1kHz and 20kHz and 1394 ohms at 20Hz. The higher output impedance in the bass led to a low-frequency rolloff into the demanding 600 ohm load, which reached –3dB at 25Hz (fig.1, cyan and magenta traces). Into a high impedance (fig.1, blue and red traces), the output was flat down to 10Hz and was just –1.5dB at 200kHz. This graph was taken with the volume control set to its maximum; note the superb matching between the channels in this graph. (The match was equally good at lower volume-control settings.) However, as with the Reference 6, the Reference 6SE's ultrasonic bandwidth decreased at lower volume control settings. At unity gain, the output was down by 3dB at 90kHz, but it was still flat almost up to 20kHz.
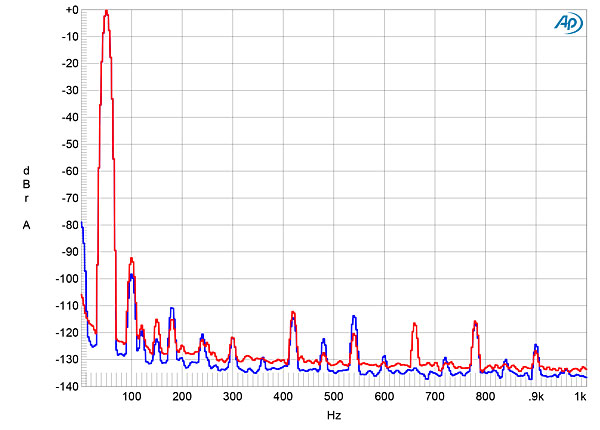
The REF 6SE's channel separation was superb, at >100dB below 3kHz and still 83dB in both directions at 20kHz. In balanced mode, the REF 6SE was very quiet. Even with the volume control set to its maximum ("103"), the wideband, unweighted signal/noise ratio, ref. 1V output with the input shorted, was very good, at 81dB. This ratio improved to a superb 99.9dB, right, and 98.1dB, left, when the measurement bandwidth was restricted to the audioband and to 103.2dB and 100.9dB, respectively, when I switched an A-weighting filter into the circuit. Repeating the S/N measurement from the unbalanced outputs reduced the wideband, unweighted ratios by 15dB, and even with an A-weighted measurement, the unbalanced ratios were 10dB lower than the balanced ratios.
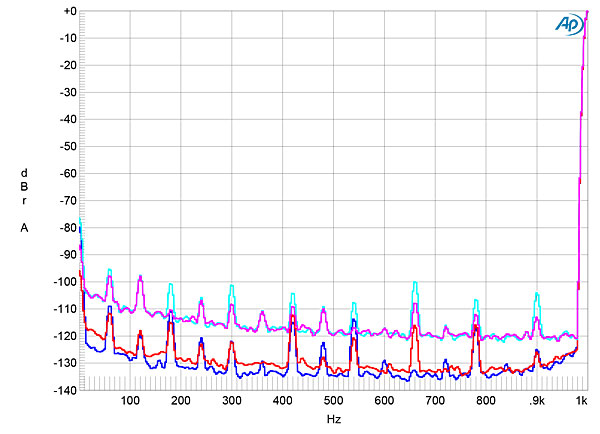
This can be seen in fig.2, which shows the spectra of the REF 6SE's balanced (blue and red traces) and unbalanced (cyan, magenta) noise floors while it reproduced a 1kHz tone at 1V into 100k ohms. Some very low-level, odd-order harmonics of the AC supply frequency can be seen in both channels, perhaps due to magnetic interference from the power transformers being picked up by the tubes' steel pins. However, even with the unbalanced outputs, all the spuriae lie below –100dB (0.001%) and will be inconsequential.
While I was measuring the Audio Research preamplifier, I had some anomalous but unrepeatable test results, which led me to wonder whether, as the REF 6SE's top panel is acrylic rather than metal, it doesn't shield the circuitry from RF interference. I investigated this by measuring the wideband, unweighted signal/noise ratio at the unbalanced output before and after turning on a compact fluorescent light bulb. (CFL bulbs may be efficient, but they emit RF interference.) While bringing the CF bulb close to the Audio Research's top panel reduced the wideband ratio by 8dB in the left channel and by 20dB in the right, the degradation was just 1dB in both channels with the CF bulb a couple of feet away. Even with its acrylic top panel, the REF 6SE appears to be sufficiently shielded from RF interference.
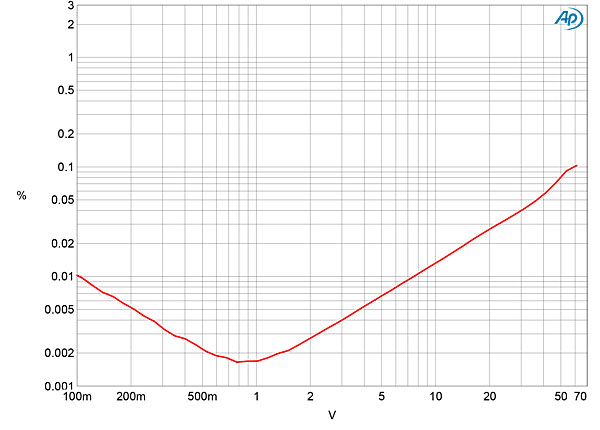
Fig.3 plots the THD+noise percentage against the left channel's balanced output voltage into 100k ohms. Below 1V output, the distortion is buried beneath the noise floor, indicated by the upward slope of the trace with decreasing voltage. The distortion slowly rises above 1V but is still just a low 0.1% at 60V RMS, which was when the Audio Precision generator was outputting its maximum signal of 15V. With clipping defined as when the THD+N reaches 1%, the single-ended output clipped at 10V into 100k ohms, which is still well above any level needed to drive a power amplifier into overload, though the distortion at lower levels was higher than it is with the balanced output. The balanced output clipped at 2.5V into 600 ohms; the REF 6SE should not be used with power amplifiers having an input impedance of less than 10k ohms.
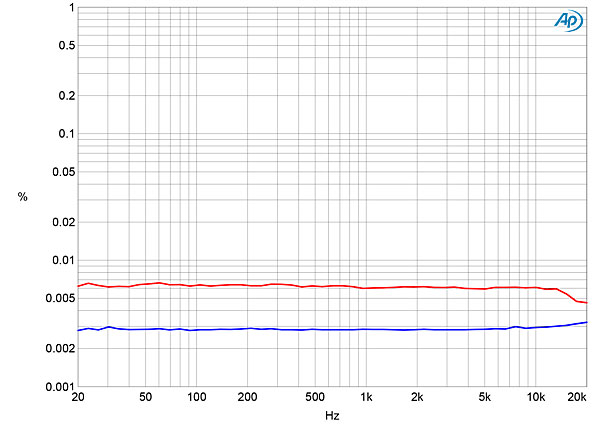
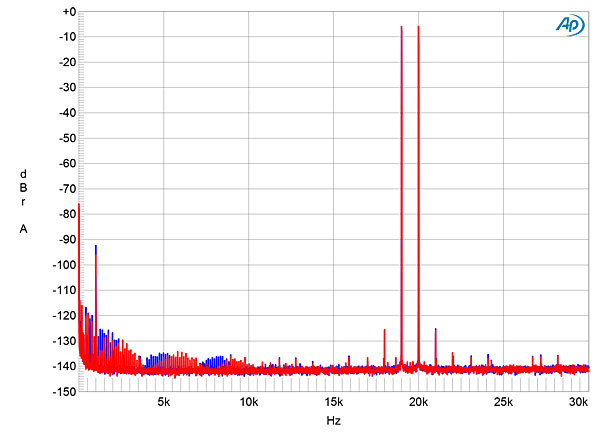
I examined how the THD+N percentage changed with frequency at a balanced output level of 2V into 100k ohms, which is sufficiently high to ensure that I was measuring THD rather than noise. The right channel's distortion (fig.4, red trace) is slightly higher than the left's (blue), but both are still extremely low. Fig.5 indicates that the only distortion harmonic present in the balanced output was the second, which would be subjectively innocuous even at higher levels. The second harmonic lay at –100dB, 0.001%, in the left channel (blue trace) and –93dB, 0.0022%, in the right channel (red). The second harmonic rose to –70dB (0.03%) at the same output voltage from the unbalanced outputs. Intermodulation distortion was also extremely low (fig.6). The second-order difference product at 1kHz with an equal mix of 19kHz and 20kHz tones lay at just –93dB (0.0022%) in the left channel and –97dB (0.0014%) in the right. Higher-order intermodulation products were even lower in level.
Like the original REF 6, Audio Research's Reference 6SE offers measured performance from its balanced outputs that is above reproach. However, as its unbalanced outputs offer higher distortion and noise, the REF 6SE's balanced outputs are to be preferred, as long as the preamplifier is partnered with power amplifiers featuring high input impedances. As JVS's Dan D'Agostino amplifier has an input impedance of 100k ohms at 20Hz and 1kHz and still 70k ohms at 20kHz, it was a good match for the Audio Research preamplifier.—John Atkinson


