Sidebar 3: Measurements
After copying the necessary test tones to its internal memory, I measured the Astell&Kern A&ultima SP1000 with my Audio Precision SYS2722 system (see the January 2008 "As We See It"). I couldn't obtain a 2.5mm balanced connector, so all measurements were taken from the single-ended 3.5mm headphone jack, with the volume control set to its maximum of "150" unless otherwise noted. (The volume control appears to operate in 0.5dB steps.) The SP1000 was running the 1.01CM firmware when I performed the measurements. (As I was packing up the unit to ship to our cover photographer, it updated its firmware to v.1.04 via my WiFi network.)
The A&ultima SP1000 preserved absolute polarity (ie, was non-inverting), and its output impedance, including 6' of interconnect, was both very low and close to the specification at 1.4 ohms from 20Hz to 20kHz. The maximum 20kz. maximum output level was 2.23V with data sampled at 44.1kHz. But to my surprise, when I measured the output level with 384kHz PCM data and DSD data, the output was clipped—it hadn't been clipped at the lower sample rate. I reduced the volume to "145," where the sinewave was no longer clipped, and examined the output level at all sample rates. It was 0.05dB lower at 88.2 and 96kHz than at 44.1 and 48kHz, and 0.2dB lower at 176.4 and 192kHz, but 2.3dB higher with 384kHz, DSD64, and DSD128 data (footnote 1). A puzzle.
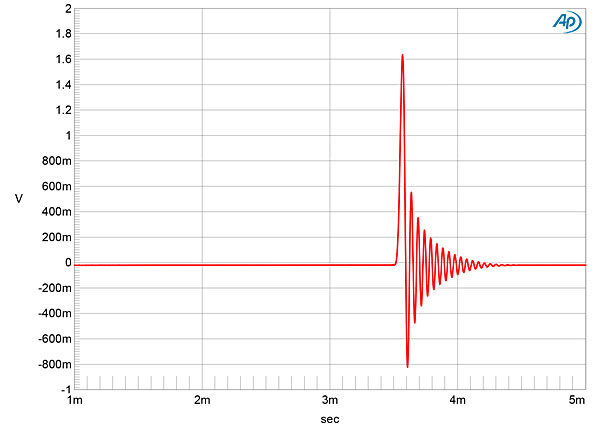
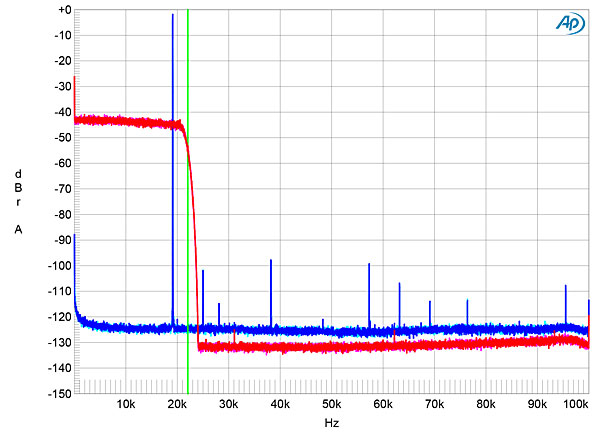
Fig.1 shows the SP1000's impulse response with 44.1kHz data. It reveals the reconstruction filter to be a minimum-phase type, with all ringing following the single sample at 0dBFS. With 44.1kHz-sampled white noise at –4dBFS (fig.2, red and magenta traces), the player's output rolled off above 20kHz, reaching its stopband level above 24kHz. (The vertical green line in this graph indicates the Nyquist frequency, which is half the sample rate of 44.1kHz.) With a full-scale tone at 19.1kHz (blue and cyan traces), the aliased image of the tone at 25kHz is suppressed by more than 100dB, and the distortion harmonics are all very low in level.
Footnote 1: My thanks to Malcolm Omar Hawksford for preparing these DSD test files for me.
Fig.1 Astell&Kern A&ultima SP1000, impulse response (one sample at 0dBFS, 44.1kHz sampling, 4ms time window).
Fig.2 Astell&Kern A&ultima SP1000, wideband spectrum of white noise at –4dBFS (left channel red, right magenta) and 19.1kHz tone at 0dBFS (left blue, right cyan), with data sampled at 44.1kHz (20dB/vertical div.).
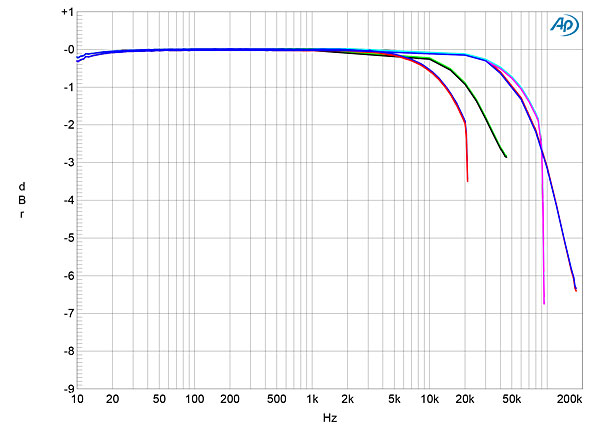
Fig.3 shows the A&ultima's frequency response at sample rates of 44.1, 96, 192, and 384kHz, with the level at the last rate adjusted for the level difference noted earlier. The rolloffs at 44.1 and 192kHz are similar but different in shape from those at 96 and 384kHz, which are shallower. While performing these measurements, I noted something odd with 96kHz data. Unlike with the other sample rates, the trace on the screen of the oscilloscope I use to monitor a product's analog output was discontinuous, and very similar to what I've found with so-called NOS (Non-OverSampling) DACs. There must be a problem with the implementation of the reconstruction filter with 96kHz data.
Fig.3 Astell&Kern A&ultima SP1000, frequency response at –12dBFS into 100k ohms with data sampled at: 44.1kHz (left channel green, right gray), 96kHz (left cyan, right magenta), 192kHz (left blue, right red), 384kHz (left blue, right green) (1dB/vertical div.).
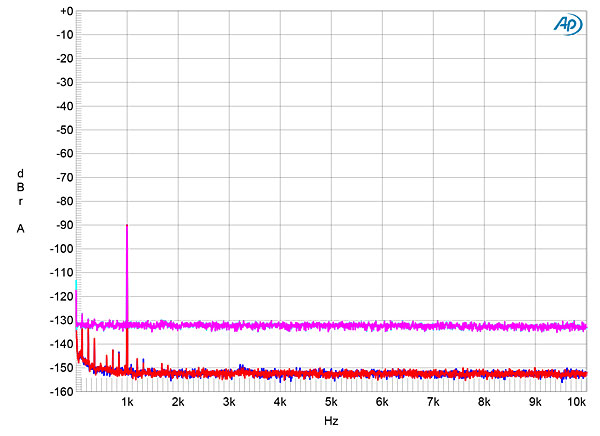
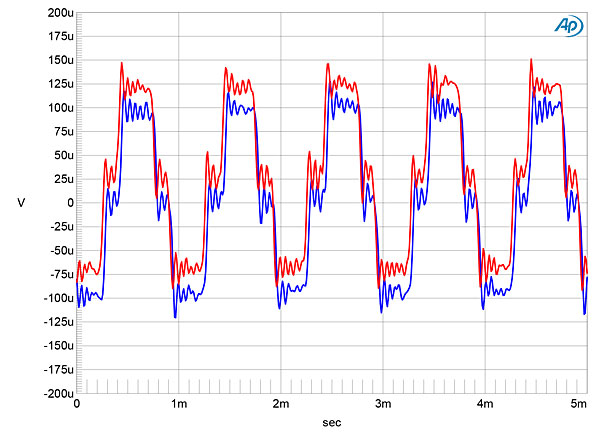
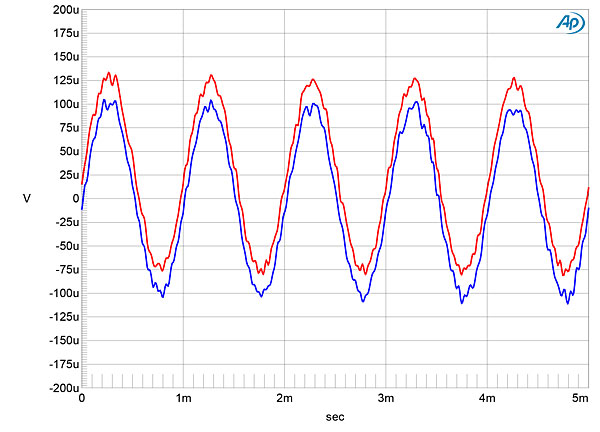
Channel separation was superb, at >100dB in the midrange, though it did decrease at lower frequencies, presumably due to the rising power-supply impedance. But the A&ultima's noise floor was both free from spuriae and very low in level. With a dithered tone at –90dBFS, increasing the data's bit depth from 16 to 24 dropped the noise floor by more than 20dB (fig.4), implying resolution of at least 19 bits—superb behavior for a digital product that runs off a 5V battery! With undithered data representing a 1kHz tone at –90.31dBFS, the superb resolution and low level of analog noise allowed the waveform to be accurately reproduced (fig.5), with both the three DC voltages and the minimum-phase filter's ringing readily apparent. With undithered 24-bit data, the result was a clean sinewave (fig.6).
Fig.4 Astell&Kern A&ultima SP1000, spectrum with noise and spuriae of dithered 1kHz tone at –90dBFS with: 16-bit data (left channel cyan, right magenta), 24-bit data (left blue, right red) (20dB/vertical div.).
Fig.5 Astell&Kern A&ultima SP1000, waveform of undithered 1kHz sinewave at –90.31dBFS, 16-bit data (left channel blue, right red).
Fig.6 Astell&Kern A&ultima SP1000, waveform of undithered 1kHz sinewave at –90.31dBFS, 24-bit data (left channel blue, right red).
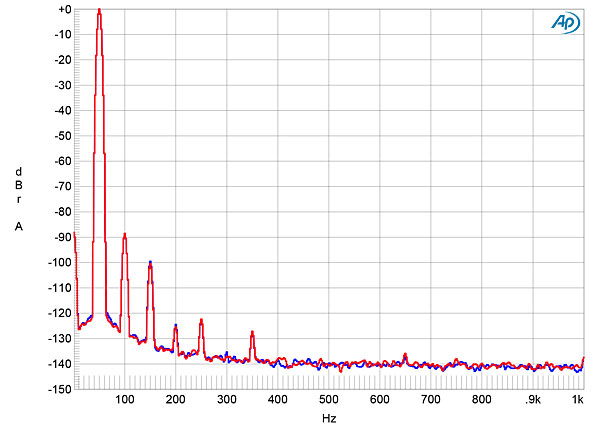
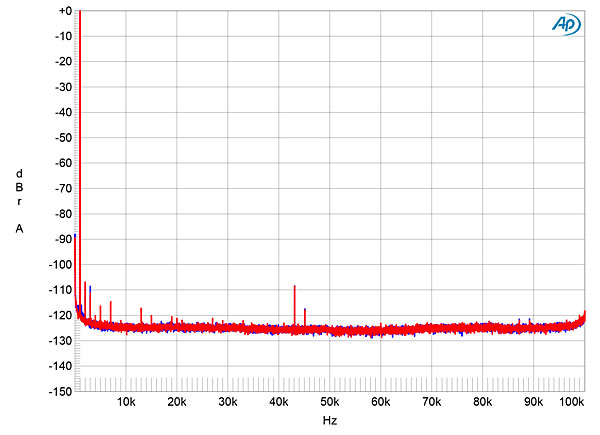
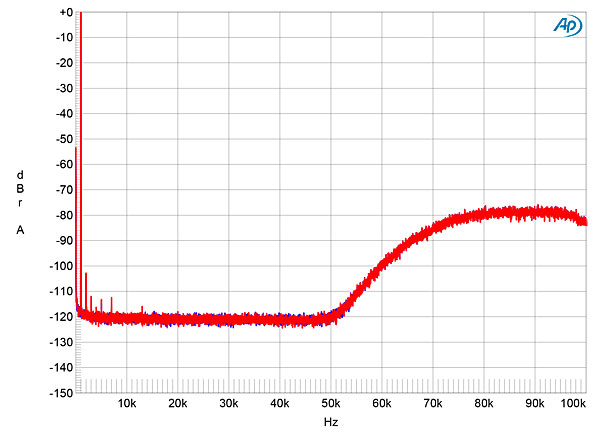
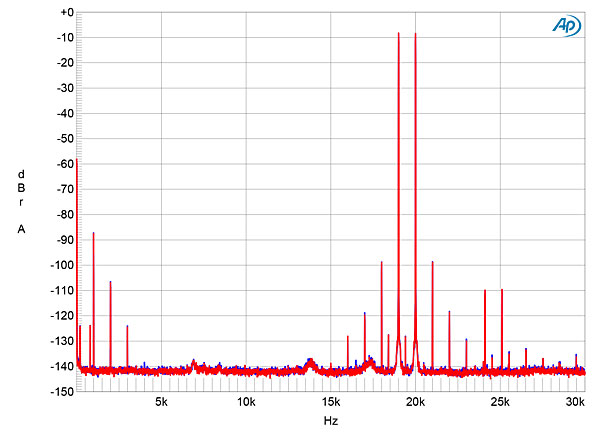
At maximum level into 100k ohms, the SP100 produced very low levels of harmonic distortion (fig.7), with the innocuous second harmonic the highest in level, at just –90dB (0.003%). But into lower impedances, the output started to clip with the volume control set to "150." Into 300 ohms, for example, which is typical of the impedance of Sennheiser headphones, the output clipped at "145." I doubt that this will be a problem at normal listening levels, even with low-impedance 'phones. Figs. 8 and 9 are wideband spectra respectively taken with a full-scale 1kHz tone with 24/44.1 and DSD128 data. The ultrasonic noise floor with PCM data is clean, while with DSD data, you can see the rise in the floor above 50kHz, due to the single-bit encoding. Intermodulation distortion was also very low, even into 300 ohms (fig.10).
Fig.7 Astell&Kern A&ultima SP1000, spectrum of 50Hz sinewave, DC–1kHz, at 0dBFS into 100k ohms (left channel blue, right red; linear frequency scale).
Fig.8 Astell&Kern A&ultima SP1000, spectrum of 1kHz sinewave, DC–100kHz, at 0dBFS into 100k ohms, 24-bit/44.1kHz data (left channel blue, right red; linear frequency scale).
Fig.9 Astell&Kern A&ultima SP1000, spectrum of 1kHz sinewave, DC–100kHz, at 0dBFS into 100k ohms, DSD128 data (left channel blue, right red; linear frequency scale).
Fig.10 Astell&Kern A&ultima SP1000, HF intermodulation spectrum, DC–30kHz, 19+20kHz at 0dBFS into 100k ohms, 44.1kHz data (left channel blue, right red; linear frequency scale).
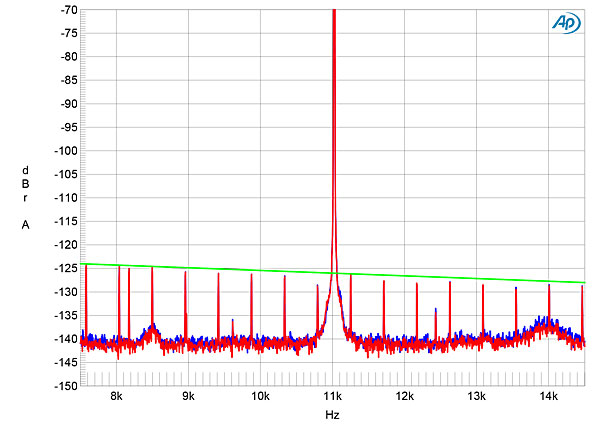
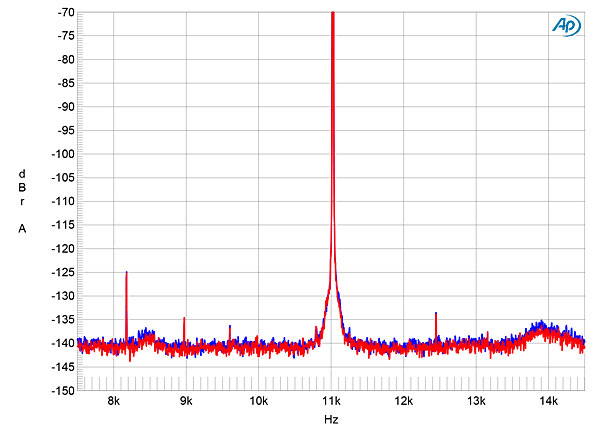
When I tested for jitter with 16-bit and 24-bit/44.1kHz J-Test data (figs.11 & 12), all the odd-order harmonics of the LSB-level, low-frequency squarewave were at the correct level, other than the one just below the spectral spike that represents the high-level tone at 11.025kHz. Some spreading can be seen at the base of this spike, presumably due to low levels of low-frequency, random jitter, but a couple of spurious tones can be seen just above 8 and 12kHz. These are very low in level, however, respectively lying at –125 and –134dB, and I am confident they will not be audible.
Fig.11 Astell&Kern A&ultima SP1000, MQA filter, high-resolution jitter spectrum of analog output signal, 11.025kHz at –6dBFS, sampled at 44.1kHz with LSB toggled at 229Hz: 16-bit data (left channel blue, right red). Center frequency of trace, 11.025kHz; frequency range, ±3.5kHz.
Fig.12 Astell&Kern A&ultima SP1000, MQA filter, high-resolution jitter spectrum of analog output signal, 11.025kHz at –6dBFS, sampled at 44.1kHz with LSB toggled at 229Hz: 24-bit data (left channel blue, right red). Center frequency of trace, 11.025kHz; frequency range, ±3.5kHz.
Other than that anomalous behavior with 96kHz data, Astell&Kern's A&ultima SP1000 acquitted itself well on the test bench. And for it to offer such superb resolution with a low-voltage battery supply is commendable.—John Atkinson
Footnote 1: My thanks to Malcolm Omar Hawksford for preparing these DSD test files for me.


