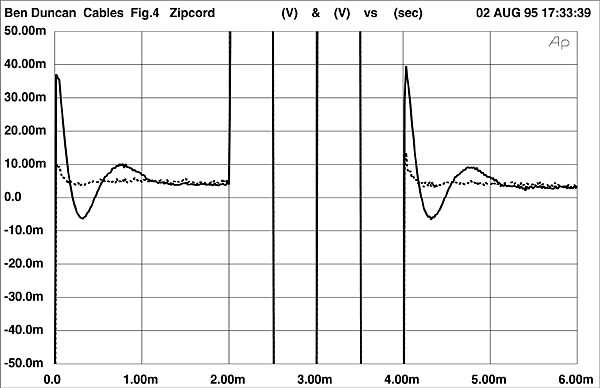
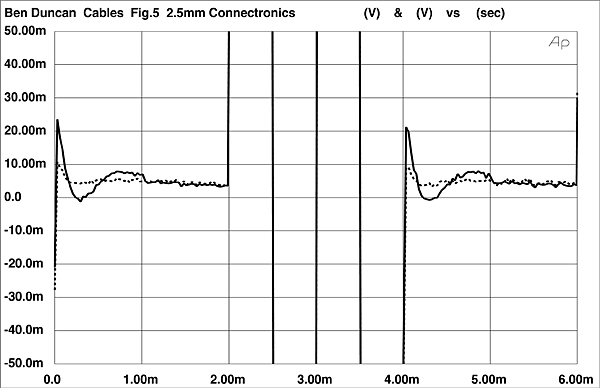
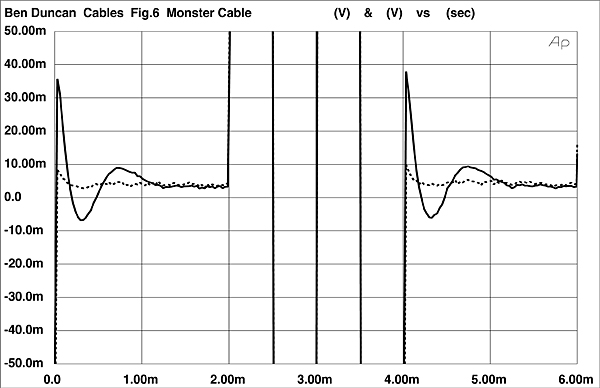
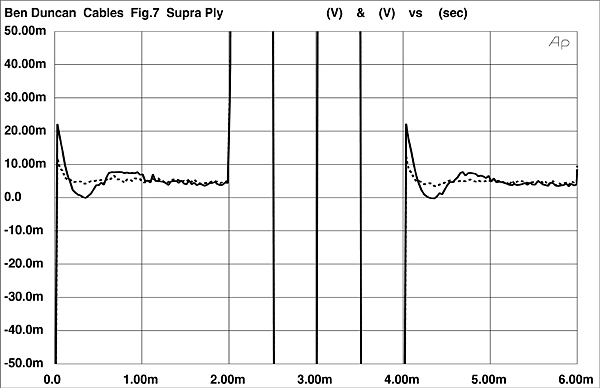
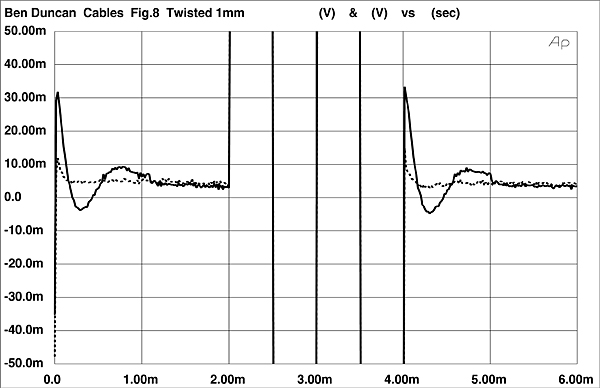
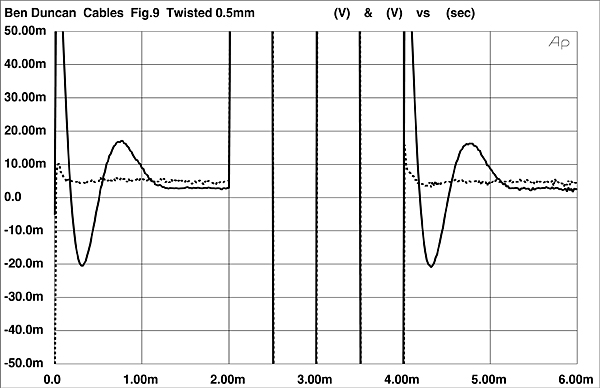
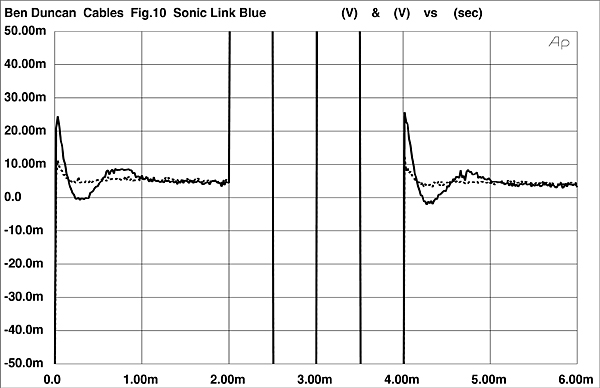
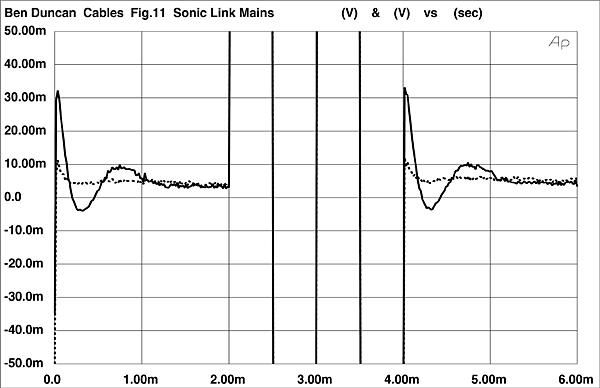
The first series of tests (figs.4–11) used the 1kHz toneburst signal. In each graph, one of the two traces can be seen to be almost flat. This is always the more tightly controlled response, measured at the amplifier output terminals. Deviations here indicate deficiencies with the amplifier's negative feedback control. The other wilder, more wavy response is the imperfect damping measured at the speaker end. The different responses directly show each of the cables' ability to aid the action of the amplifier's NFB. The ranking (based on the distance between the first negative impulse and subsequent positive peak, in grid units and rounded to two significant figures) is:
Supra Ply: 0.7
Connectronics: 0.8
Sonic Link blue: 1.0
Sonic Link mains: 1.3
Twisted 1mm: 1.3
Monster Cable: 1.5
Zipcord: 1.5
Twisted 0.5mm solid: 3.6
In the above and all subsequent tables, the top of the list indicates best performance. Notice that even at this upper-midrange frequency, the damping-in-time varies. For example, the purpose-made top two cables have clearly damped to a low level after the first three half-cycles, whereas with some of the others, a distinct gap remains well after the third half-cycle. Also, the negative peak excursion is considerably smaller than the positive in some (zipcord and solid-core), whereas the difference between successive half-cycles of damping is less pronounced for the Connectronics and Supra Ply. As these two apparently present the smallest or shortest "damping demand" on the amplifier, the difference may be the NFB needing to act less. A curious feature, considering their physical differences, is the peaking similarity between the Monster Cable and zipcord.
Test Group 2
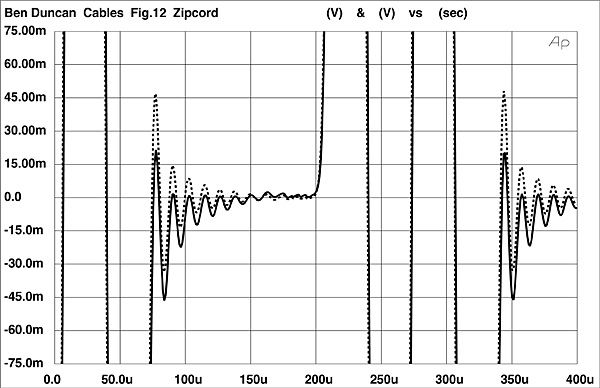
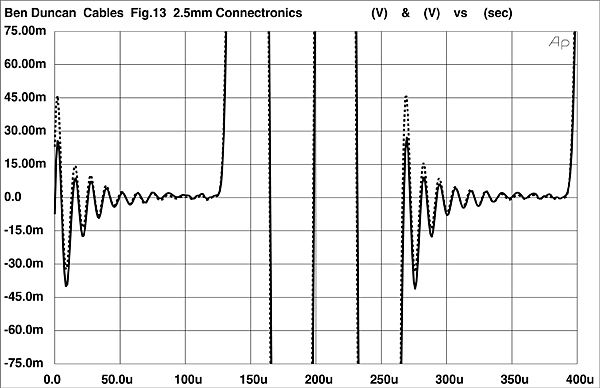
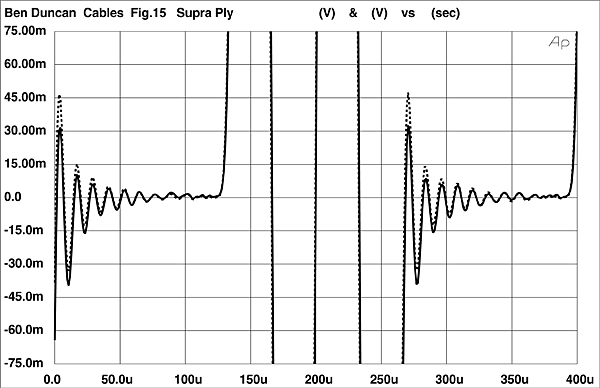
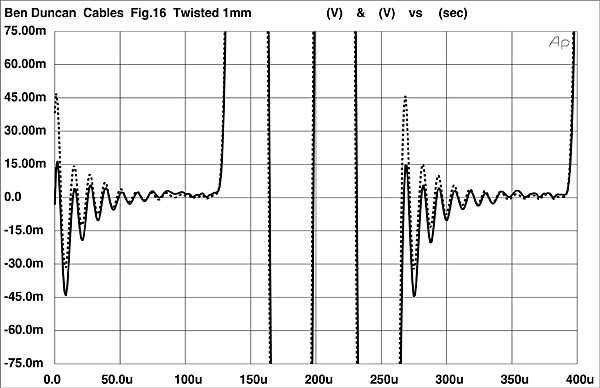
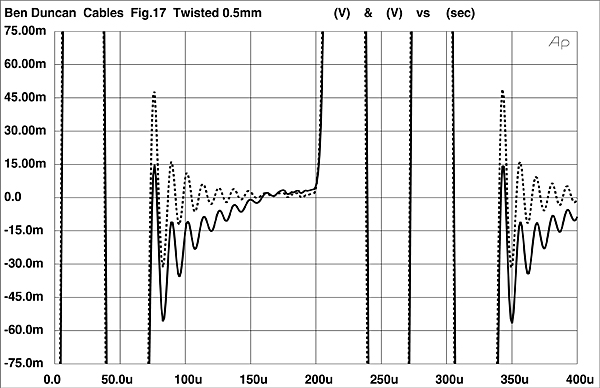
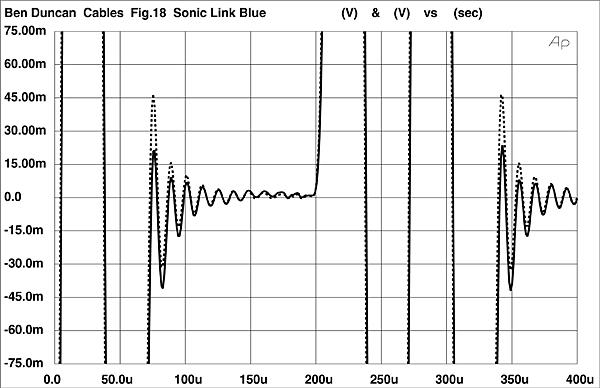
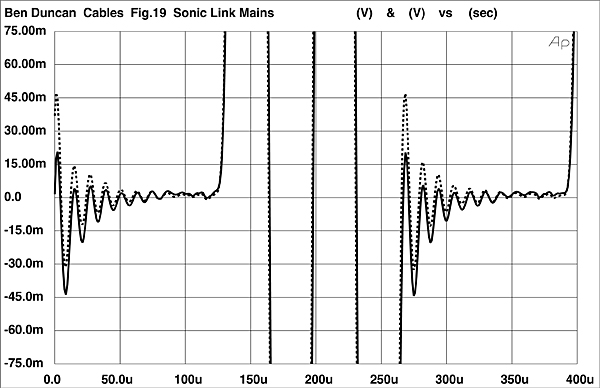
HF testing was carried out at 15kHz (figs.12–19). In all cases the signal shows a quite large but well-enough-damped ringing at the driven end. This is a common enough power-amplifier imperfection. Notice how much the peak amplitude of the larger of the two plots—which is always the signal at the speaker end—varies. Again, ranking is based on the difference in grid units between the first and second half-cycles. Surprisingly at such a high frequency, some of the fat, low-resistance cables are damping best—if not in the order one would predict from their CSA:
Supra Ply: 5.7
Sonic Link blue: 5.8
Connectronics: 5.8
Twisted 1mm: 6.0
Sonic Link mains: 6.1
Monster Cable: 6.2
Zipcord: 6.2
Twisted 0.5mm solid: 7.0
The ranking method is ad hoc. What happens if it's changed? The ranking below is the difference between the Send and Receive waveforms, with the cable having the least overall difference first. Again, the difference is in grid units:
Supra Ply: 1.0
Connectronics: 1.3
Sonic Link blue: 1.6
Sonic Link mains: 1.7
Zipcord: 1.8
Monster Cable: 2.0
Twisted 1mm 2.0
Twisted 0.5mm solid: 2.1

Test Group 3
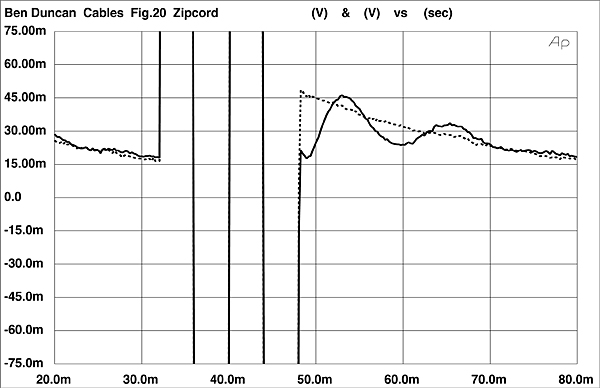
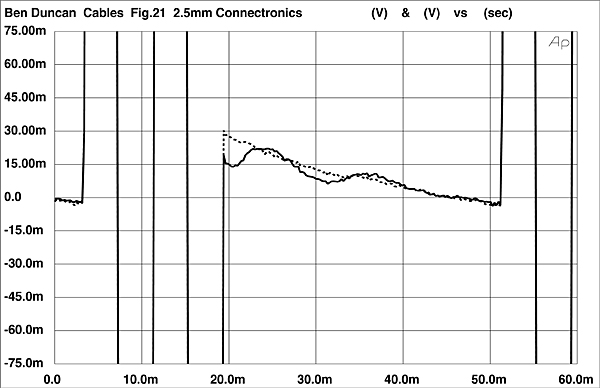
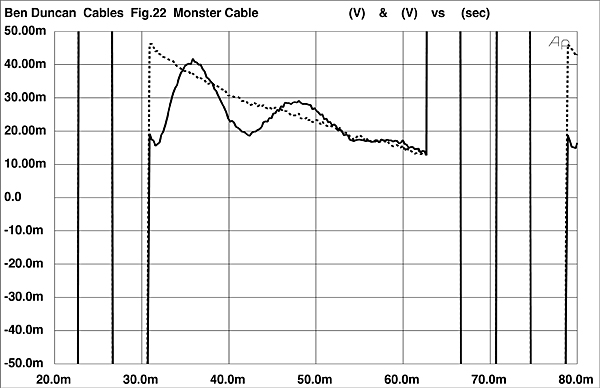
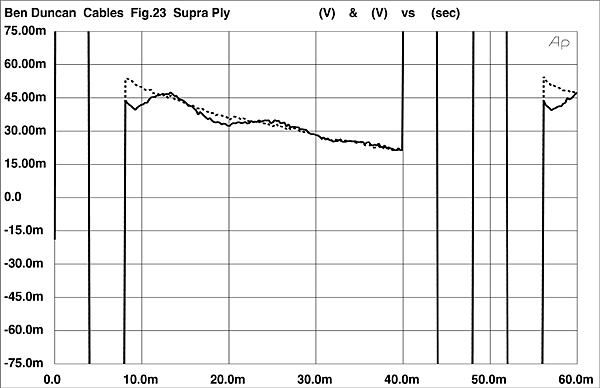
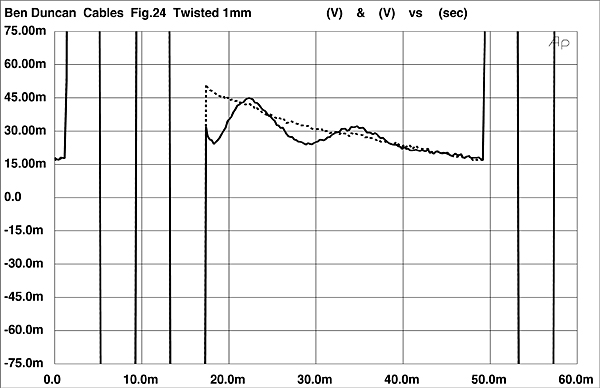
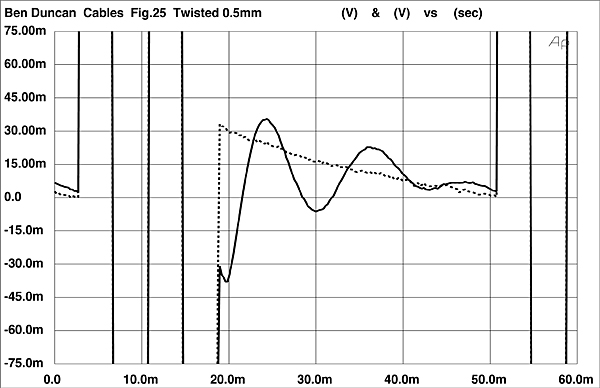
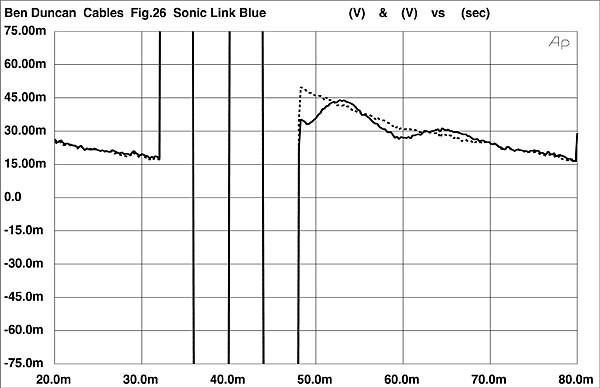
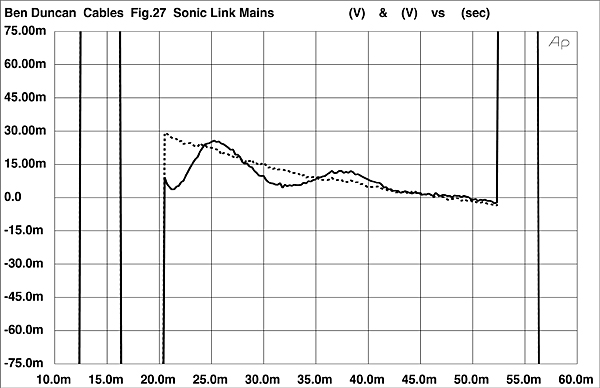
Testing next at an upper-bass frequency, 125Hz (figs.20–27), the spread is similar and no less interesting. The best damped ranking, again based on the vertical grid units between the first two half-cycles, is:
Supra Ply: 0.4
Connectronics: 0.6
Sonic Link blue: 0.8
Sonic Link mains: 1.4
Twisted 1mm: 1.4
Monster Cable: 1.7
Zipcord: 1.8
Twisted 0.5mm solid: 4.8
Notice that at the point where the sinewave starts again, the destination signals in the zipcord and the 0.5mm solid-core cables have not wholly reconverged on the drive signal (look for the tiny gap), demonstrating not just poorer damping, but also excess dispersion or sluggish settling—this is likely to be different at other frequencies.
Controls
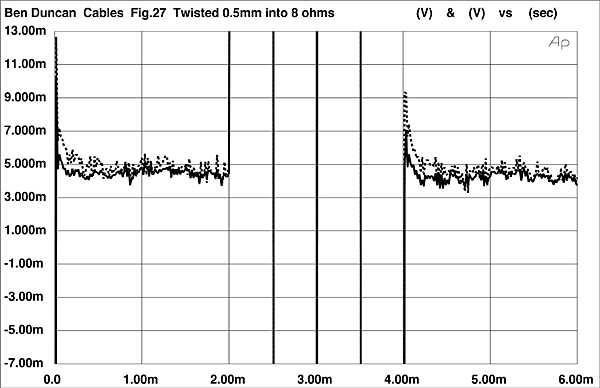
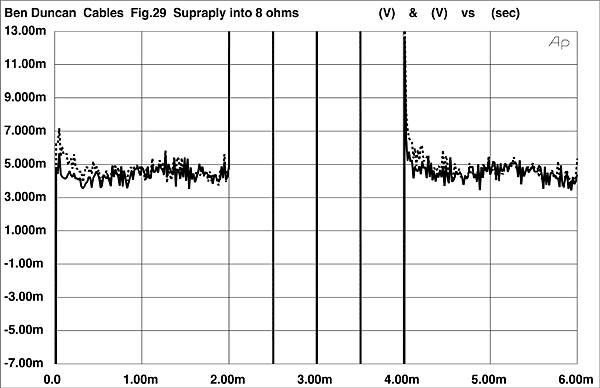
A natural follow-up question is: "How much are these results due to the cable's own characteristics, as opposed to the speakers'?" In figs.28 and 29, the worst- and best-performing cables were connected to an 8 ohm, 1kW–rated test load that is almost purely resistive. Now the differences are smaller, but still clearly discernible on this scale. So we may conclude that cables do exhibit measurable energy storage, but that a speaker's own energy storage usually swamps this.
Next, a control was run: The best-performing cable was reconnected the next day and replotted. Repeatability was very close. Small differences were due to the finite certainty of the Audio Precision's sampling and the display screen pixels, and to variations in contact resistance in both the XLR connections and the AP's relays.
Summary
For the first time, large differences have been demonstrated between different cables connecting a loudspeaker driven with a discontinuous signal (that represents a music transient) using industry-standard test equipment, and without recourse to exotic techniques. At 45mV relative to 1.3V RMS peak drive, alias –29dB down—or just 1 part in 28—the size of the largest measured perturbations is surprising. With the best-performing cables, perturbations are reduced to about 1/10 of this, or –50dB down. Hence the measurements show how cables expressly designed for audio, and in particular for speakers, can improve damping perturbations by at least 20dB.
Better cables also shorten settling time. The results clearly demonstrate the limitations (at least with a full-range speaker) of the conventional, simplistic approach of using the fattest wire, as well as the futility of using a thin solid core (footnote 6). The results also illustrate the logic of making special cables for AC power purposes—considering that mains current into any DC power supply is a burst waveform, much as is simulated here.
These tests make clear that Supra Ply is indeed a star performer, as claimed. Against a wider range of audio-grade cables, it would not be surprising if one or two of the other low-inductance types were strong competitors. But the point of this article is simply to show that cables do differ measurably in ways that relate to music. The measurements provide a way of short-listing serious contenders and eliminating spaced-eight cables from serious consideration, after which readers must make their own decisions based on cost and relative sonics in the context of their monitoring system(s).
Caveats
Even without advertising hype and misinformation, determining the "best" speaker cable for a given real-world situation is a complex issue. If your power amplifier turns into an RF oscillator because it can't handle high or even modest capacitance (and some otherwise reputable designs can easily fail under these conditions), you'd likely find the sonics better with a lesser (but less-capacitative) cable. If no one bothers to check for RF, using suitable equipment (at least a 35MHz 'scope), entirely wrong sonic decisions can be made. If RF occurs, then to use the low-inductance cable that speakers need, you should consider a) having the amplifier retired or sold; b) having the amplifier re-engineered for proper stability, using parts costing as little as $20; or c), less drastic than the first two options, moving the amplifier(s) next to (or much nearer to) the loudspeakers, so the cable capacitance (always a product of length) is slashed.
Another pitfall is with tube amplifiers, and transistor amplifiers with zero or low overall negative feedback. Their damping can be so poor (far worse than the situation seen in figs.12–19) that the cable's damping differences documented here may be swamped, again leading to a different optimum.
Acknowledgments
This article was made possible by the kind assistance of David Heaton of Audio Synthesis. Thanks also to Dr. Keith Holland at ISYR, Southampton University, UK; Patrik Lagerstedt; Mark Dodd; Matt Dobson; Richard Black; and Phillip Newell.
Footnote 6: Alvin Gold, "The Designer Series: Dennis Morecroft," Hi-Fi News & Record Review, August 1987.


