Sidebar 3: Measurements
I performed a complete set of measurements on one of the Unison Research Reference amplifiers (serial number 350072R) with my Audio Precision SYS2722. The amplifier preserved absolute polarity with both the balanced and unbalanced inputs and one of the two sets (8 ohm and 4 ohm) of output transformer binding posts. As mentioned in the amplifier's user manual, the two sets of binding posts are connected in parallel. A rotary knob on the front panel simply acted as an on-off switch. The gain was identical, at a low 16.2dB, with both types of inputs and, unusually, from both output transformer taps.
The Unison Research Reference's measured performance is what I would have expected from a single-ended, transformer-coupled tubed circuit, with predominantly second-harmonic distortion and reduced linearity at the frequency extremes. The amplifier offers relatively high power as long as the load impedance is higher than the nominal output transformer tap value. The single-ended input is preferable to the balanced.—John Atkinson
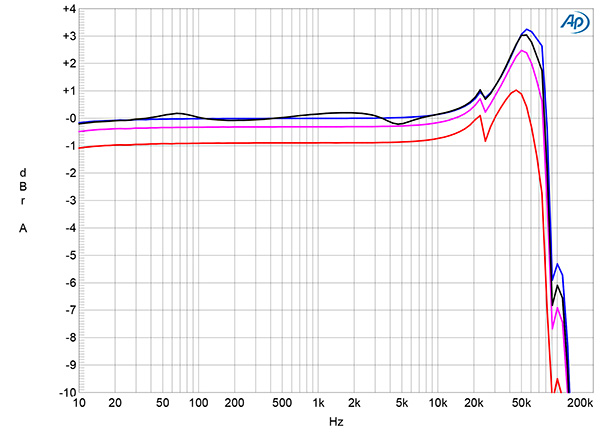
Fig.1 Unison Research Reference, 8 ohm output tap, frequency response at 2.83V into: simulated loudspeaker load (gray), 8 ohms (blue), 4 ohms (magenta), and 2 ohms (red) (2dB/vertical div.).
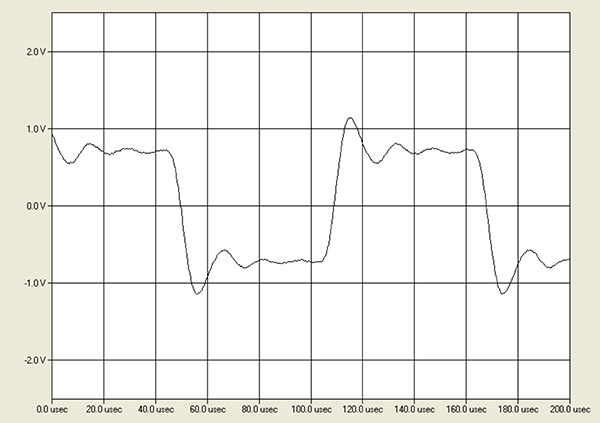
Fig.2 Unison Research Reference, 8 ohm output tap, small-signal 10kHz squarewave into 8 ohms.
The input impedance is specified as 10k ohms balanced and 47k ohms unbalanced. The balanced input impedance was slightly lower than the specified value, at 7.8k ohms across the audioband. The single-ended input impedance was also slightly lower than specified, at 40.5k ohms at 20Hz and 1kHz, dropping inconsequentially to 39k ohms at 20kHz. The output impedance was relatively low for an amplifier with a tubed output stage; it was the same from both output transformer taps, at 0.3 ohms at 20Hz and 1kHz and 0.2 ohms at 20kHz. As a result, the variation in the frequency response with our standard simulated loudspeaker (fig.1, gray trace) was just ±0.2dB. The response into resistive loads (blue, magenta, red traces) was flat in the audioband, peaking by up to 3dB above the audioband, between 50kHz and 60kHz, with a sharp rolloff above that region then a small peak at 100kHz. The lower-frequency ultrasonic peak was associated with some overshoot and ringing with the Unison Research's reproduction of a 10kHz squarewave (fig.2).
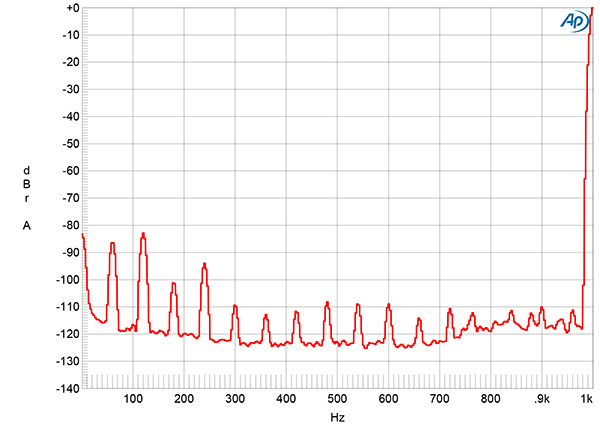
Fig.3 Unison Research Reference, unbalanced input, 8 ohm output tap, spectrum of 1kHz sinewave, DC–1kHz, at 1W into 8 ohms (linear frequency scale).
The unweighted, wideband signal/noise ratio (ref. 1W into 8 ohms), taken with the unbalanced input shorted to ground, was a good 72.4dB from the 8 ohm output, 74dB from the 4 ohm output. These ratios mproved, respectively, to 79.8dB and 79dB when the measurement bandwidth was restricted to 22Hz–22kHz and to 93.8dB when A-weighted. Spectral analysis of the low-frequency noisefloor while the Unison Research drove a 1kHz tone at 1W into 8 ohms revealed a fairly low random noisefloor. Even- and odd-order harmonics of 60Hz were present (fig.3), the highest in level (120Hz) at –83dB. This spectrum was taken using the unbalanced input. When I repeated the analysis using the balanced input and the same output level, the supply-related spuriae were all much higher in level. The 60Hz tone now lay at –66dB, the 120Hz tone at –69dB, and the higher-order spuriae all lay between –71dB and –87dB. RvB told me that he used the unbalanced input.
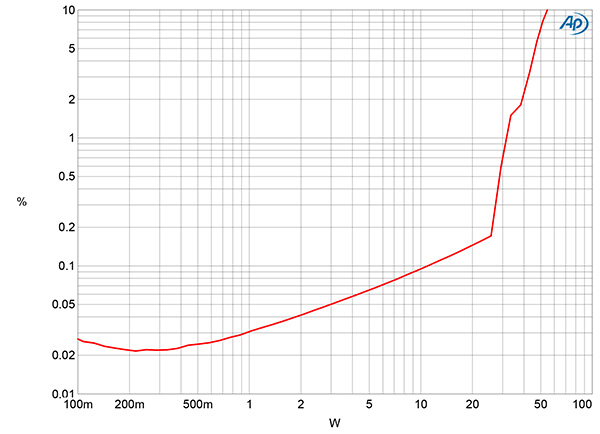
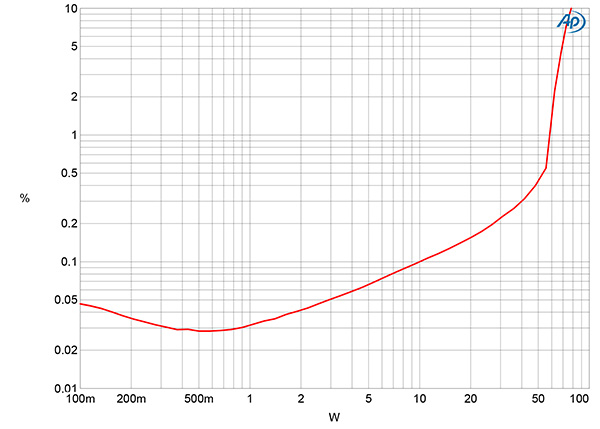
Fig.4 Unison Research Reference, 8 ohm output tap, distortion (%) vs 1kHz continuous output power into 16 ohms.
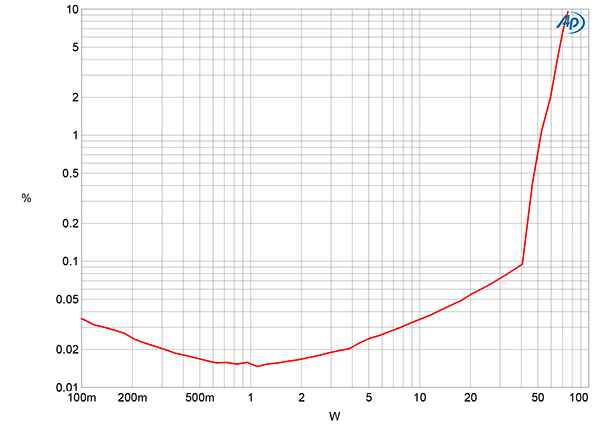
Fig.5 Unison Research Reference, 8 ohm output tap, distortion (%) vs 1kHz continuous output power into 8 ohms.
Fig.6 Unison Research Reference, 8 ohm output tap, distortion (%) vs 1kHz continuous output power into 4 ohms.
Unison Research specifies the Reference amplifier's maximum continuous power as 80W, but without mentioning a load impedance or THD percentage. (80W is equivalent to 22dBW into 16 ohms, 18.75dBW into 8 ohms, and 16dBW into 4 ohms.) With Stereophile's usual definition of clipping power—when the THD+noise reaches 1%—both output taps clipped with a 1kHz signal at 31W into 16 ohms (17.9dBW, fig.4), 52.7W into 8 ohms (17.2dBW, fig.5), and 59W into 4 ohms (14.7dBW, fig.6). (The THD+N is commendably low at lower powers into all three impedances.) Relaxing the definition of clipping to 3% THD+N, the amplifier clipped at 42.5W into 16 ohms (17.9dBW), 62W into 8 ohms (18.1dBW), and 65W into 4 ohms (15.1dBW). The amplifier reached its specified maximum power of 75W at almost 10% THD+N with a 1kHz signal. Tested with a 20kHz signal and using our usual (1% THD+N) definition of clipping power, the amplifier clipped just below 10W into 8 ohms (10dBW).
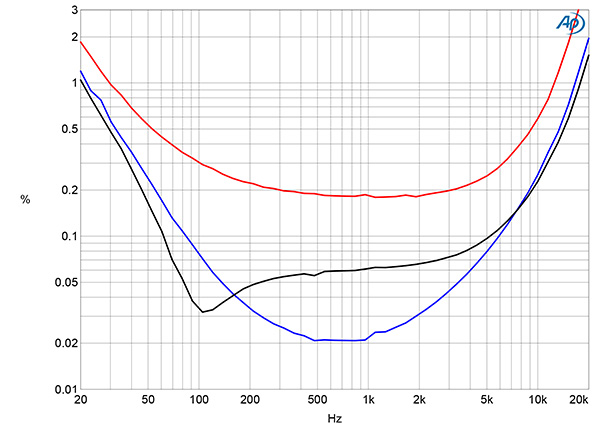
Fig.7 Unison Research Reference, 8 ohm output tap, THD+N (%) vs frequency at 9.1V into: 16 ohms (gray), 8 ohms (blue), and 4 ohms (red).
This shortfall in 20kHz clipping power can be seen in fig.7, which examines how the THD+N percentage varied with frequency at 9.1V, equivalent to 5.2W into 16 ohms (gray trace), 10.35W into 8 ohms (blue), and 20.7W into 4 ohms (red). The THD+N percentage was extremely low in the midrange and low treble into 8 ohms (blue trace), but higher into both 16 ohms and 4 ohms. It also rose significantly at low and high frequencies.
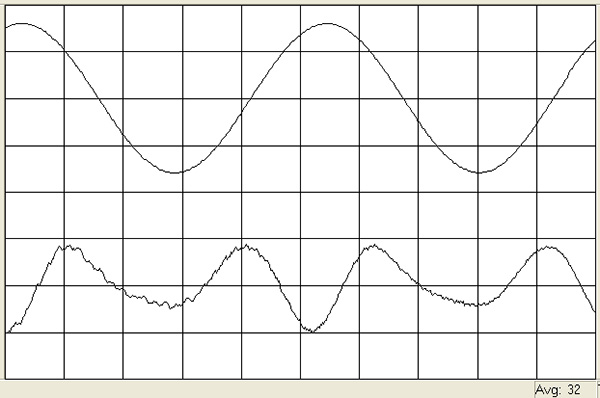
Fig.8 Unison Research Reference, 8 ohm output tap, 1kHz waveform at 10W into 8 ohms, 0.034% THD+N (top); distortion and noise waveform with fundamental notched out (bottom, not to scale).
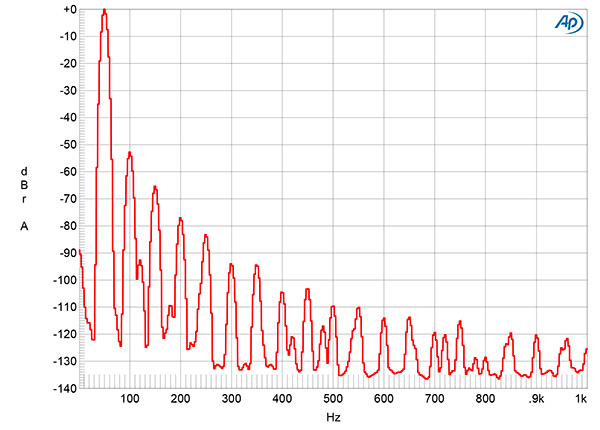
Fig.9 Unison Research Reference, 8 ohm output tap, spectrum of 50Hz sinewave, DC–1kHz, at 10W into 8 ohms (linear frequency scale).
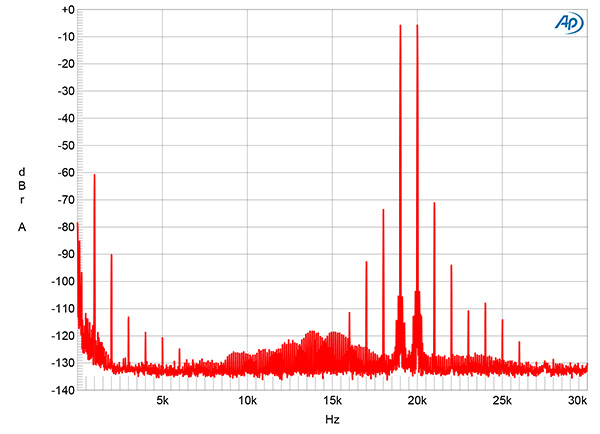
Fig.10 Unison Research Reference, 8 ohm output tap, HF intermodulation spectrum, DC–30kHz, 19+20kHz at 3W peak into 8 ohms (linear frequency scale).
Fortunately, the distortion in the midrange was predominantly the second harmonic (fig.8), though this was joined by higher-order harmonics at lower levels at the same power with a 50Hz signal (fig.9). Because of the circuit's reduced linearity in the top audio octave, intermodulation distortion with an equal mix of 19 and 20kHz tones was disappointing. At 10W peak into 8 ohms, the difference product at 1kHz lay close to –50dB (0.3%), with higher-order products not much lower in level. Repeating the spectral analysis at 3W peak into 8 ohms reduced the levels of both the difference product and the higher-order products by 10dB (fig.10).