Sidebar 1: Sony PCM-1630 Measurements
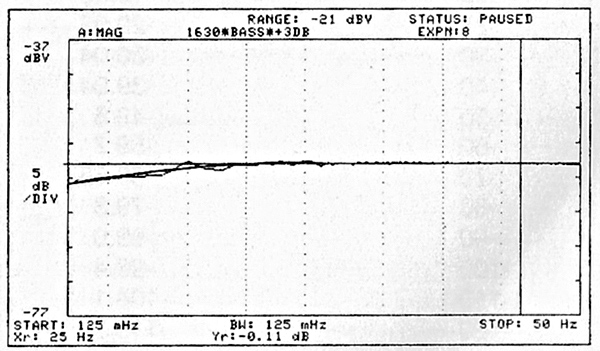
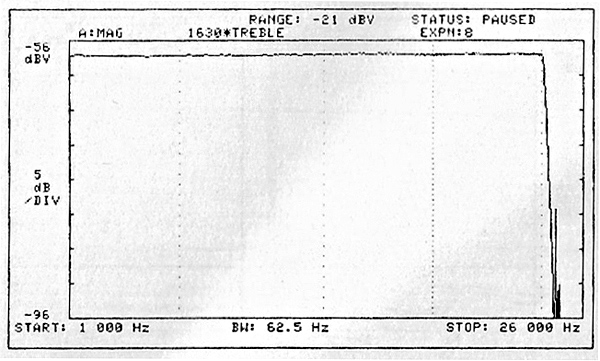
Sony specifies a tolerance of +0.5, –1dB for the PCM-1630's overall record/play frequency response; when measured with emphasis off, the result was a fine +0.2, –0.9dB from 10Hz to 20kHz (fig.1 shows the infrasonic response from 0.125Hz to 50Hz, fig.2 shows the response from 1kHz to 26kHz). The anti-alias filter came into effect above 20kHz; at 22kHz, for example, the output was already 50dB down. Considering the minor nature of the variations in frequency response, there is unlikely to be an audible effect.
 The record/replay linearity was checked using a precision spectrum analyzer over the full available dynamic range: the surprisingly good results are given in Table 1, which shows that a decent amount of dither has been incorporated to effectively linearize the low-level performance. For comparison, most CD players generate considerable linearity errors by –90dB modulation, typically 3–5dB, while errors of 10dB are not uncommon. The 1630 was 1dB accurate over the record/replay cycle at –90dB and continued to store and recover analyzed sinewaves placed well into the broadband noise floor, eg, down to –120dB.
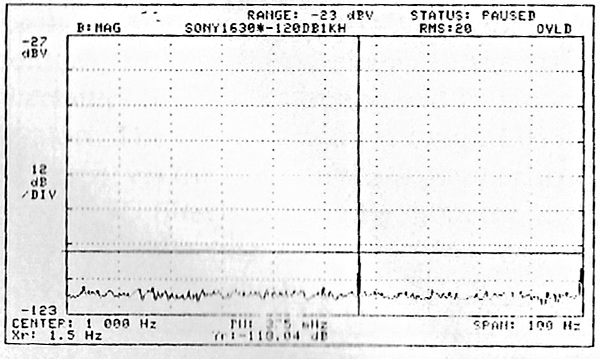
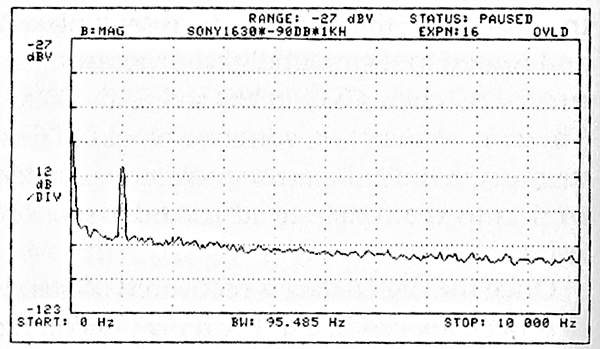
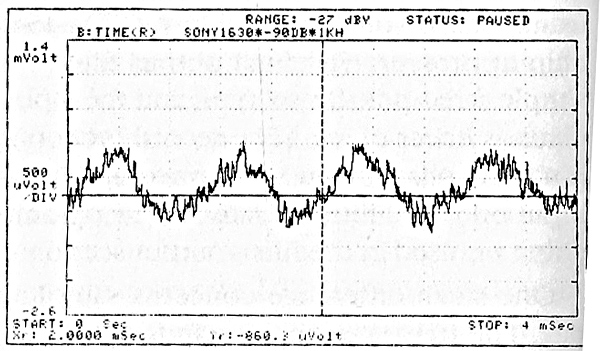
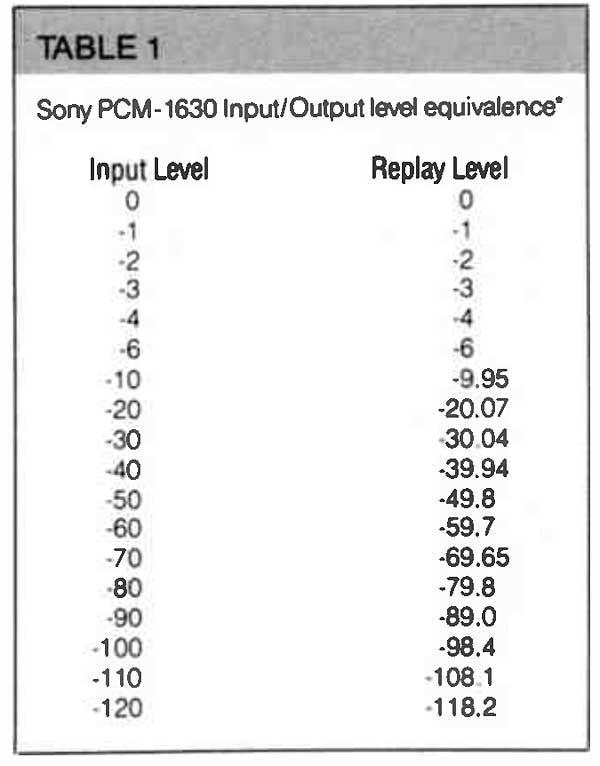 Fig.3, a ±50Hz zoomed analysis, actually shows that a 1kHz signal can be recovered at –118.04dB, over 20dB below the cutoff point of an undithered 16-bit system! Returning to more realistic signal levels, fig.4 shows the harmonic spectrum, or should I say the lack of it, for a sinewave recorded at –90dB. Fig.5 shows the corresponding waveshape, a substantially pure one, masked by the presence of some random-looking noise.
 A fine performance was seen in the replay of a 400Hz squarewave with a sensible risetime (fig.10). The flat tops confirm the extended low-frequency bandwidth, with quite moderate ringing. When the input was driven with a fast-risetime (10µs) impulse, the input alias filter rang quite hard, and the output was not linear phase (fig.11). However, it was non-inverting.
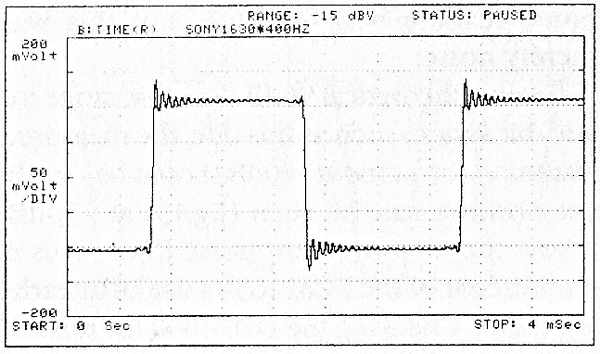
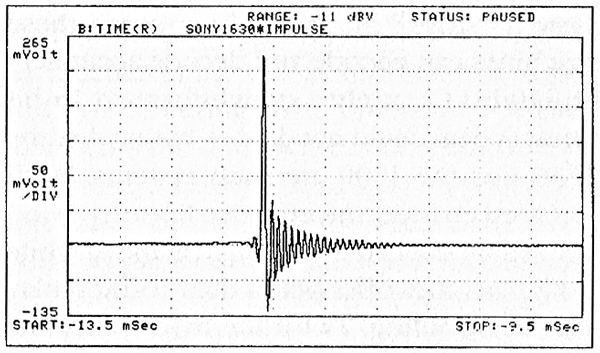
Fig.1 Sony PCM-1630, frequency response, 0.125–50Hz (3dB/vertical div.)
Fig.2 Sony PCM-1630, frequency response, 1–26kHz (5dB/vertical div.).
The two channels agreed closely on the measured parameters, and the unweighted signal/noise ratio was fine at 96dB with preemphasis, 90dB without. Using the CCIR ARM (1kHz) weighting, the benefit of preemphasis is shown more clearly with more representative record/play noise ratios of 85dB without preemphasis, 90dB with.
Full level—0dB—on the excellent level meters, indicated virtually full modulation; unlike VU-meter systems, however, there was no additional margin.
Fig.3, a ±50Hz zoomed analysis, actually shows that a 1kHz signal can be recovered at –118.04dB, over 20dB below the cutoff point of an undithered 16-bit system! Returning to more realistic signal levels, fig.4 shows the harmonic spectrum, or should I say the lack of it, for a sinewave recorded at –90dB. Fig.5 shows the corresponding waveshape, a substantially pure one, masked by the presence of some random-looking noise.
Fig.3 Sony PCM-1630, 1kHz at –118.04dBFS (12dB/vertical div.).
Fig.4 Sony PCM-1630, 1kHz at –90dBFS (12dB/vertical div.).
Fig.5 Sony PCM-1630, 1kHz waveform at –90dBFS (0–4ms).
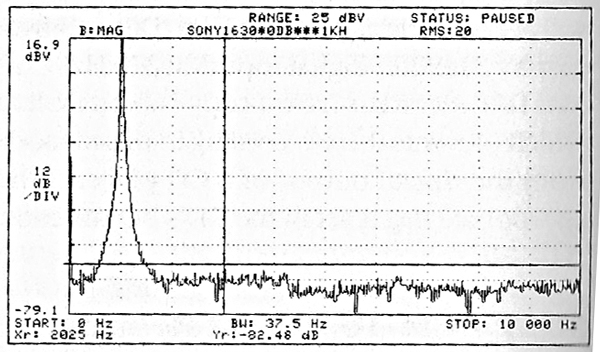
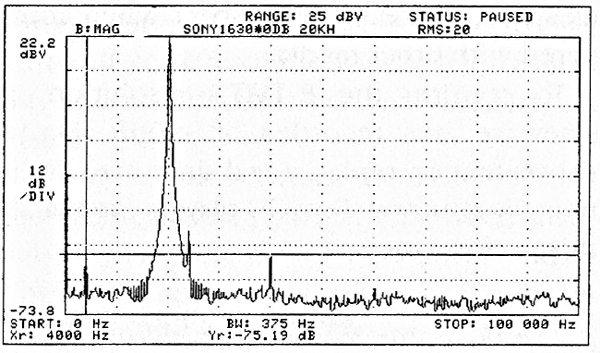
This good distortion picture was little changed when the unit was driven to full level (fig.6, 1kHz signal at 0dB). Third harmonic at –82.5dB (better than 0.01%), for example, was the only significant product. Note the absence of digital spuriae. Reducing the level to –10dB resulted in little change, apart from the second harmonic now being higher in level (–82.7dB) than the third. Fig.7 shows the distortion spectrum and resulting alias products for a full-level 20kHz tone. This is a demanding test, but the result was really good, with the only significant inband spurious tone placed at 4kHz (44kHz–2×20kHz) at a harmless –75.19dB. Good suppression was also seen for the 44kHz sampling frequency, with an absence of higher-frequency products. The alias products decrease rapidly both with frequency and record level.
Fig.6 Sony PCM-1630, spectrum, 0Hz–10kHz, of 1kHz at 0dBFS (12dB/vertical div.).
Fig.7 Sony PCM-1630, spectrum, 0Hz–100kHz, of 20kHz at 0dBFS (12dB/vertical div.).
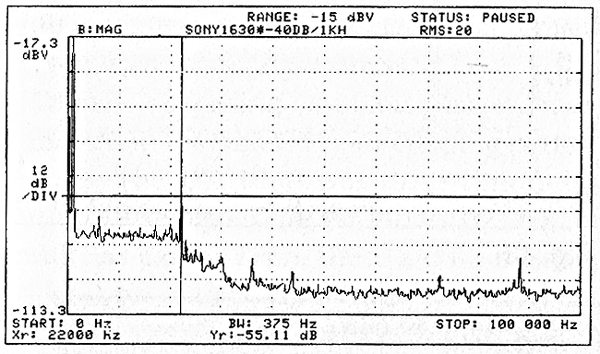
Fig.8 shows distortion for a mid-level signal, 1kHz at –40dB, the spectrogram extending to 100kHz. The 22kHz spurious product was –95dB relative to full level, while the 1kHz distortion was around 0.07% and close to the noise floor. Other spuriae were well suppressed.
Fig.8 Sony PCM-1630, spectrum, 0Hz–100kHz, of 1kHz at –40dBFS (12dB/vertical div.).
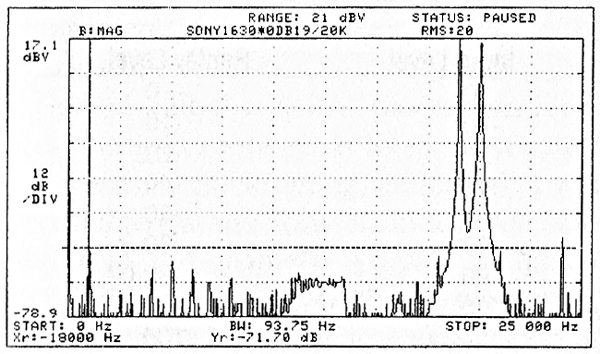
Another cruel test concerned both full-level and –10dB level intermodulation, the test signal consisting of a 1:1 mixture of 19 and 20kHz. At 0dB (fig.9), the main product was 1kHz at –71dB, a good result for a recording system, while reducing the drive level to –10dB resulted in the 1kHz product vanishing into the noise floor at –85dB.
Fig.9 Sony PCM-1630, spectrum, 0Hz–25kHz, of 19kHz & 20kHz at –10dBFS (12dB/vertical div.).
Channel separation is important in the context of a professional system, and here the 1630 confirmed its competence, exceeding 100dB from 20Hz to 20kHz: typical measurements were 20Hz, 117dB; 1kHz, 119dB; 20kHz, 103dB.
Fig.10 Sony PCM-1630, 400Hz squarewave waveform at 0dBFS (0–4ms).
Fig.11 Sony PCM-1630, impulse response (0–4ms).
These results show the PCM-1630 to be a well-developed design, with no obvious technical flaws and a wide linear dynamic range. How about its domestic equivalent?—Martin Colloms