Sidebar 3: Measurements
I performed the measurements of the Rotel RA-6000 with my Audio Precision SYS2722 system. I preconditioned the amplifier by operating it at 1/8 power into 8 ohms for 30 minutes. At the end of that time, the temperature of the top-panel grilles over the heatsinks was almost too hot to touch, at 130.4°F/54.2°C. The RA-6000 needs to be well-ventilated.
Looking first at the line-level analog inputs, the Rotel RA-6000's maximum voltage gain from the loudspeaker output at 1kHz into 8 ohms was 22.14dB for the balanced input and 27.8dB for the unbalanced inputs. For the latter, the maximum gain was 1.28dB from the Pre output and 27.84dB from the headphone output. The amplifier preserved absolute polarity, ie, was noninverting, from all its outputs. The balanced input impedance was close to the specified 100k ohms, at 94k ohms at 20Hz and 1kHz, 90k ohms at 20kHz. The unbalanced input impedance is specified as 5.6k ohms; I measured 5.65k ohms at 20Hz and 1kHz, 5.5k ohms at 20kHz. This is on the low side; tubed components with a high source impedance at low frequencies might sound a little lightweight.
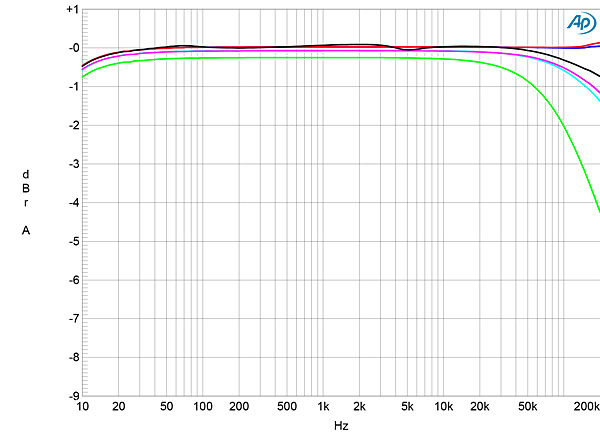
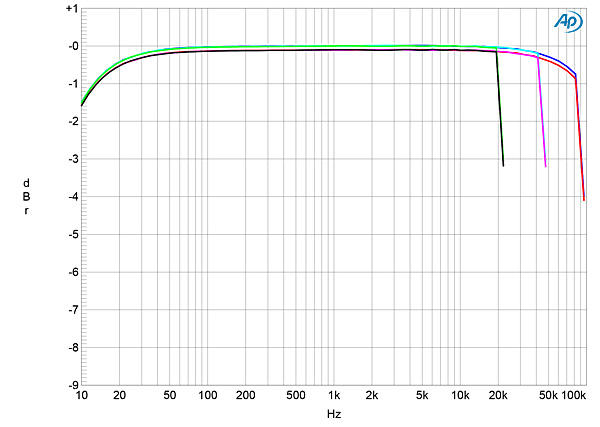
The source impedance from the Pre output was close to 100 ohms from 20Hz to 20kHz. The headphone output's source impedance was a very high 665 ohms, again at all audio frequencies, which won't be optimal for low-impedance headphones. The loudspeaker output impedance was a very low 0.09 ohms at low and middle frequencies, increasing very slightly to 0.11 ohms at the top of the audioband. The variation in the Rotel amplifier's small-signal frequency response with our standard simulated loudspeaker was just ±0.1dB (fig.1, gray trace).
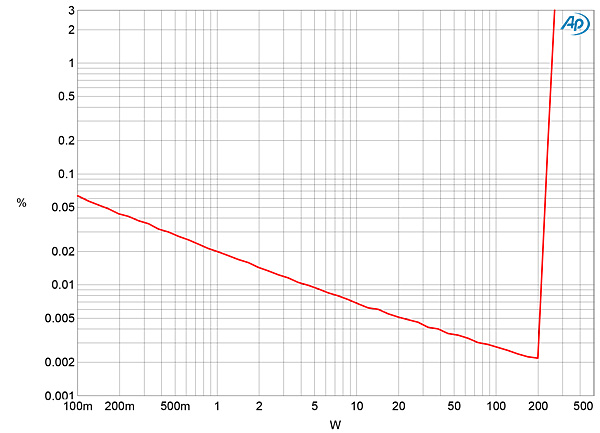
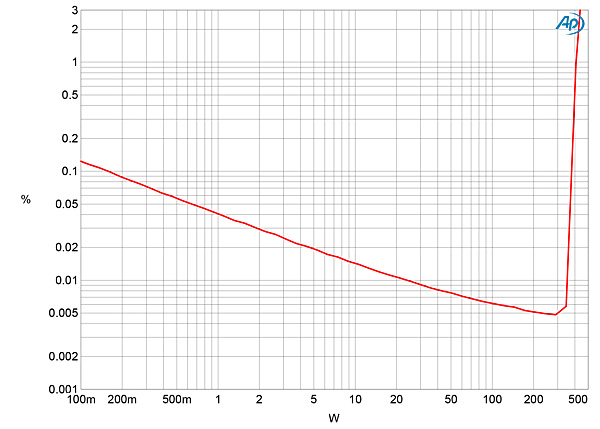
 Rotel specifies the RA-6000's maximum continuous power as 200Wpc into 8 ohms (23dBW) and 350Wpc into 4 ohms (22.4dBW). With clipping defined as when the THD+noise reaches 1%, I measured clipping powers with both channels driven of 250Wpc into 8 ohms (24dBW, fig.5) and 410Wpc into 4 ohms (23.1dBW, fig.6). The shape of the traces in these graphs suggests that the distortion lies beneath the noisefloor below the clipping power.
 Turning to the Rotel's digital inputs, its coaxial and optical S/PDIF inputs accepted data sampled at all rates up to 192kHz. Apple's AudioMIDI utility revealed that the RA-6000's USB input accepted 16- and 24-bit integer data sampled at all rates from 44.1kHz to 768kHz. Apple's USB Prober app identified the RA-6000 as "ROTEL USB Audio 2.0" from "ROTEL," and the USB port operated in the optimal isochronous asynchronous mode.
All the digital inputs preserved absolute polarity. With the volume control set to its maximum, data representing a 1kHz tone at –20dBFS resulted in a level of 299.3mV at the Pre output and 6.35V at the headphone and speaker outputs. All the following measurements were performed at the Pre output with the loudspeakers turned off. However, even without the loudspeakers active, the amplifier went into protection mode with high-level, high-frequency digital input signals. To prevent this happening, I set the volume control to –12dB for the test results shown in figs.12 and 15.
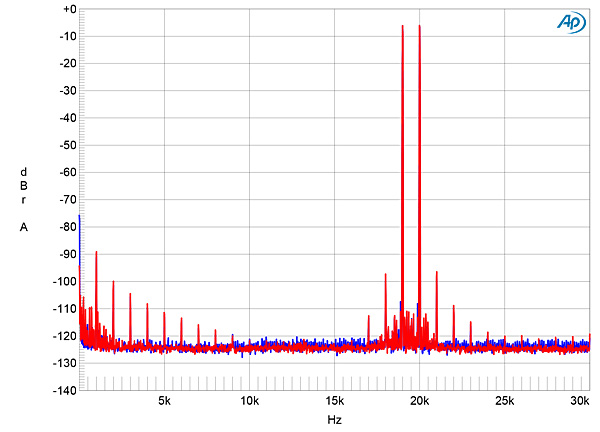
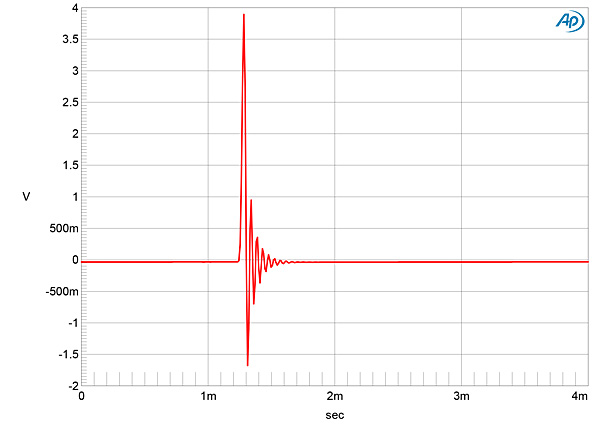
Fig.11 shows the RA-6000's impulse response with 44.1kHz data. It is typical of a short, minimum-phase reconstruction filter, with a small amount of ringing following the single full-scale sample. With 44.1kHz white-noise data (fig.12, magenta and red traces), the filter rolled off slowly above the audioband, not reaching full stop-band attenuation until 44kHz. The shape of the ultrasonic rolloff is familiar; it is typical of the filter used by MQA-capable devices for non-MQA data. With a 19.1kHz tone at –3dBFS (cyan and blue traces), the slow rolloff means that the aliased image at 25kHz is only suppressed by 17dB. The harmonics associated with the 19.1kHz tone are all very low in level, however. The Rotel's frequency responses with data sampled at 44.1, 96, and 192kHz (fig.13) all followed the same basic shape: flat in the audioband then rolling off just below half the sample rate.
Turning to the Rotel's digital inputs, its coaxial and optical S/PDIF inputs accepted data sampled at all rates up to 192kHz. Apple's AudioMIDI utility revealed that the RA-6000's USB input accepted 16- and 24-bit integer data sampled at all rates from 44.1kHz to 768kHz. Apple's USB Prober app identified the RA-6000 as "ROTEL USB Audio 2.0" from "ROTEL," and the USB port operated in the optimal isochronous asynchronous mode.
All the digital inputs preserved absolute polarity. With the volume control set to its maximum, data representing a 1kHz tone at –20dBFS resulted in a level of 299.3mV at the Pre output and 6.35V at the headphone and speaker outputs. All the following measurements were performed at the Pre output with the loudspeakers turned off. However, even without the loudspeakers active, the amplifier went into protection mode with high-level, high-frequency digital input signals. To prevent this happening, I set the volume control to –12dB for the test results shown in figs.12 and 15.
Fig.11 shows the RA-6000's impulse response with 44.1kHz data. It is typical of a short, minimum-phase reconstruction filter, with a small amount of ringing following the single full-scale sample. With 44.1kHz white-noise data (fig.12, magenta and red traces), the filter rolled off slowly above the audioband, not reaching full stop-band attenuation until 44kHz. The shape of the ultrasonic rolloff is familiar; it is typical of the filter used by MQA-capable devices for non-MQA data. With a 19.1kHz tone at –3dBFS (cyan and blue traces), the slow rolloff means that the aliased image at 25kHz is only suppressed by 17dB. The harmonics associated with the 19.1kHz tone are all very low in level, however. The Rotel's frequency responses with data sampled at 44.1, 96, and 192kHz (fig.13) all followed the same basic shape: flat in the audioband then rolling off just below half the sample rate.
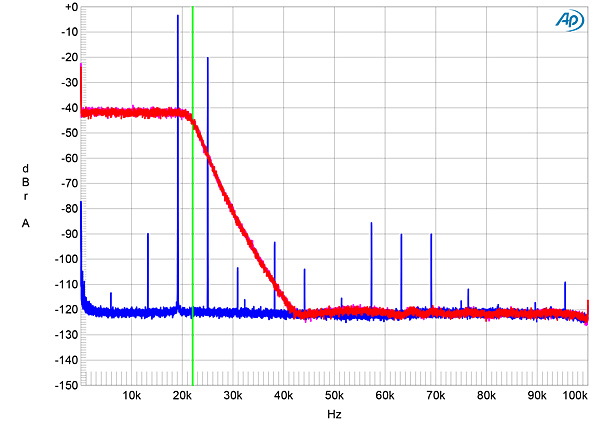
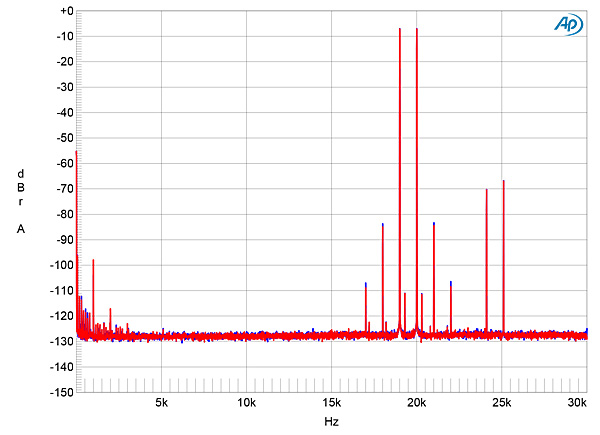
 As implied by the blue and cyan traces in fig.12, harmonic distortion via the digital inputs was low, the second and third harmonics with a full-scale 50Hz tone both lying at –90dB (0.003%). With an equal mix of 19kHz and 20kHz tones sampled at 44.1kHz and peaking at –3dBFS, aliased images at 24.1kHz and 25.1kHz are present at close to –70dB (0.03%), but the intermodulation products are very low in level (fig.17).
 The Rotel's phono input preserved absolute polarity at all three outputs. The input impedance, specified as 47k ohms, measured 64k ohms at 20Hz, 60k ohms at 1kHz, and 52k ohms at 20kHz. The phono input's audioband RIAA correction was superbly accurate in the audioband, with excellent channel matching (fig.20), though with a slight rise in the low bass before rolling off to reach –3dB at 10Hz. The response rises above 20kHz, reaching +3dB at 100kHz. This behavior is too high in frequency and too low in level to imply the presence of the so-called Neumann 4th pole modification of the original RIAA curve, but it might slightly emphasize the audibility of record clicks by adding overshoot to the transient waveform.
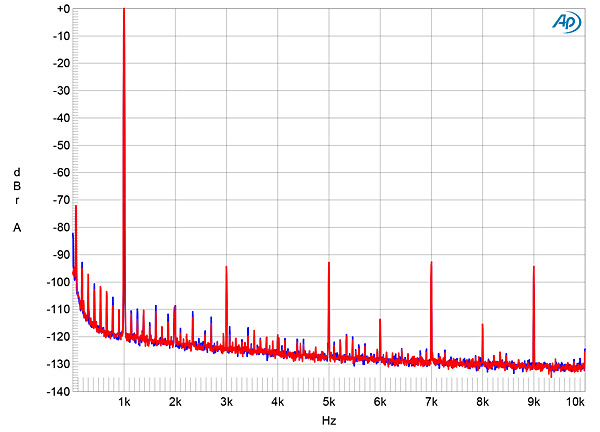
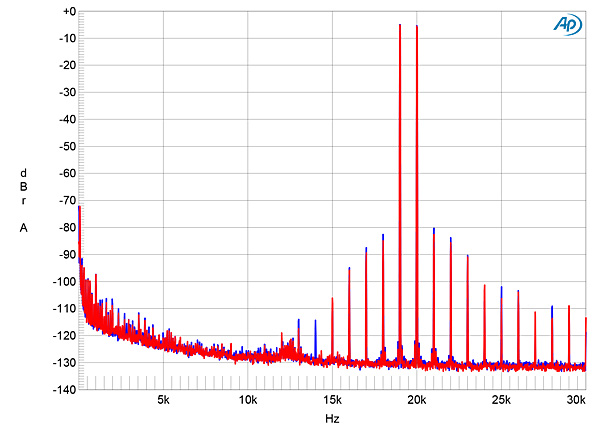
 The phono input's overload margins, measured at the Pre output and ref. 1kHz at 5mV, were superbly high at 23.5dB at 20Hz and 1kHz and 22.6dB at 20kHz. The phono input's distortion signature was primarily odd-order harmonics, but even with an input signal of 25mV these all lay below –90dB (0.003%, fig.21). Intermodulation distortion with an equal mix of 19 and 20kHz tones was also low in level, even with a signal peaking just 9dB below the overload point (fig.22).
 The Rotel RA-6000's measured performance is typical of a well-designed, modern solid state integrated amplifier. It offers high power with low distortion and a well-managed gain architecture for all three types of inputs: line, digital and phono. Although the resolution of its D/A section is relatively limited, that should be put against the low noise and high overload margins of the moving magnet phono input.—John Atkinson
Fig.1 Rotel RA-6000, frequency response at 2.83V into: simulated loudspeaker load (gray), 8 ohms (left channel blue, right red), 4 ohms (left cyan, right magenta), and 2 ohms (green) (1dB/vertical div.).
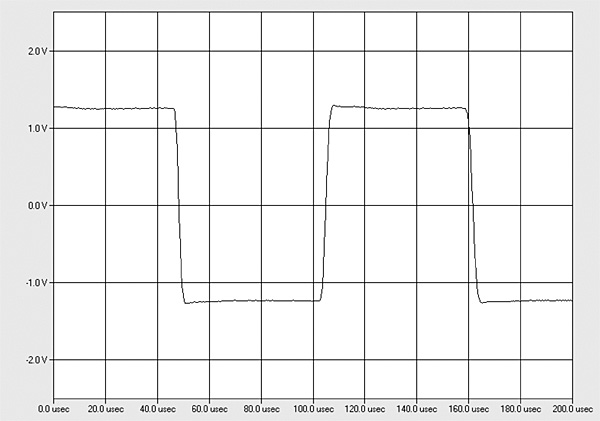
Into 8 ohms (fig.1, blue and red traces), the RA-6000 offered a very wide small-signal bandwidth, which correlated with the short risetimes in the amplifier's reproduction of a 10kHz squarewave into this load (fig.2). Commendably, despite the wide bandwidth, no overshoot or ringing was seen in the squarewave response. The increase in output impedance at very high frequencies meant that the response into 2 ohms (fig.1, green trace) was down by 2dB at 100kHz, which is inconsequential.
Fig.2 Rotel RA-6000, small-signal 10kHz squarewave into 8 ohms.
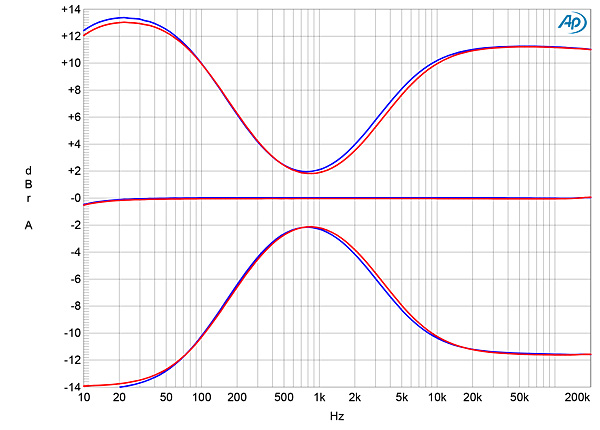
Fig.1 was taken with the volume control set to its maximum and with the tone controls bypassed; the excellent channel matching was preserved at lower settings of the control. (The volume control operates in accurate 0.5dB steps.) Switching in the tone controls but with them set to do nothing reduced the level at 1kHz by 0.1dB. Fig.3 shows the effect of the controls set to their maximum and minimum positions. They cut or boost the bass and high treble by up to 14dB. The RA-6000's channel separation (not shown) was >80dB in both directions below 2kHz, decreasing slightly to 68dB at 20kHz.
Fig.3 Rotel RA-6000, frequency response at 2.83V into 8 ohms with treble and bass controls set to "0" and to maximum and minimum (left channel blue, right red, 5dB/vertical div.)
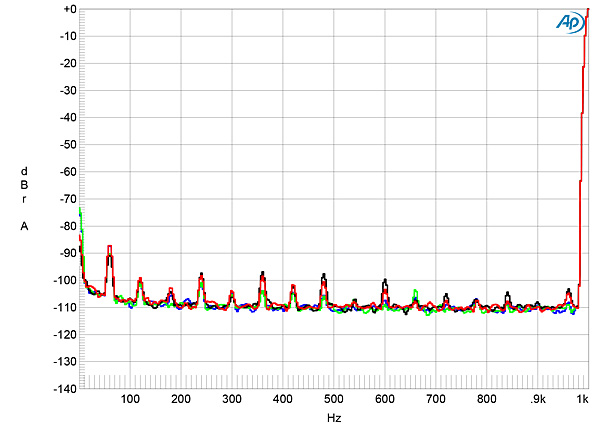
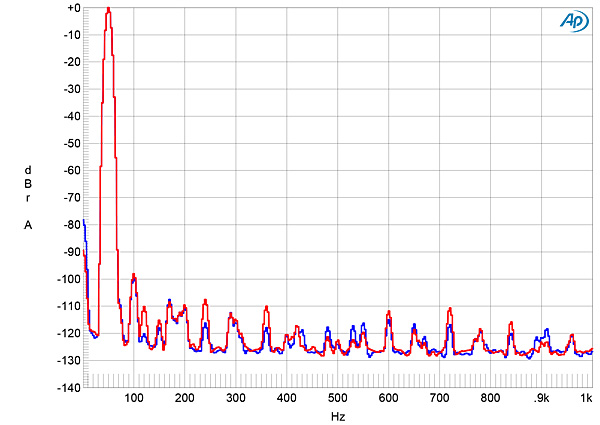
The unweighted, wideband signal/noise ratio (ref.1W into 8 ohms), taken with the unbalanced inputs shorted to ground and the volume control set to its maximum, was 60.5dB (average of the two channels), improving to 75.9dB when the measurement bandwidth was restricted to 22Hz–22kHz, and to 78.6dB when A-weighted. Spectral analysis of the low-frequency noisefloor while the Rotel amplifier drove a 1kHz tone at 1Wpc into 8 ohms with the volume control set to the maximum (fig.4, blue and red traces) revealed the presence of low-level AC-related spuriae at 60Hz and its odd- and even-order harmonics. The levels of these spuriae didn't change when I repeated the analysis with the volume control set to –12dB (fig.4, green and gray traces).
Fig.4 Rotel RA-6000, spectrum of 1kHz sinewave, DC–1kHz, at 1Wpc into 8 ohms with volume control set to its maximum (left channel blue, right red) and to –12dB (left green, right gray) (linear frequency scale).
Fig.5 Rotel RA-6000, distortion (%) vs 1kHz continuous output power into 8 ohms.
Fig.6 Rotel RA-6000, distortion (%) vs 1kHz continuous output power into 4 ohms.
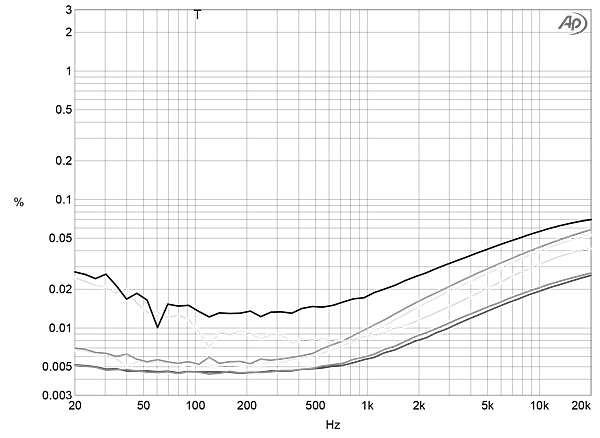
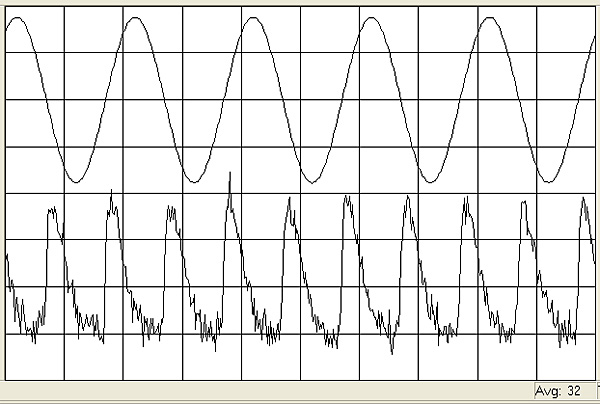
Fig.7 shows how the percentage of THD+N in both channels varied with frequency at 20V, which is equivalent to 50W into 8 ohms (blue and red traces), 100W into 4 ohms (cyan and magenta traces), and 200W into 2 ohms (green and gray traces). The THD+N was very low in the midrange and bass into 8 and 4 ohms but rose into 2 ohms and at high frequencies. (The latter will be due to the reduction in open-loop bandwidth as the frequency rises.) The distortion waveform was predominantly the subjectively innocuous second harmonic (fig.8), which lay close to the level of the AC supply-related spuriae (fig.9). Intermodulation distortion was also very low in level, even at 100Wpc into 4 ohms (fig.10).
Fig.7 Rotel RA-6000, THD+N (%) vs frequency at 20V into 8 ohms (left channel blue, right red), 4 ohms (left cyan, right magenta) , and 2 ohms (left green, right gray).
Fig.8 Rotel RA-6000, left channel, 1kHz waveform at 50W into 8 ohms, 0.0056% THD+N (top); distortion and noise waveform with fundamental notched out (bottom, not to scale).
Fig.9 Rotel RA-6000, spectrum of 50Hz sinewave, DC–1kHz, at 50Wpc into 8 ohms (left channel blue, right red; linear frequency scale).
Fig.10 Rotel RA-6000, HF intermodulation spectrum, DC–30kHz, 19+20kHz at 100Wpc peak into 4 ohms (left channel blue, right red; linear frequency scale).
Fig.11 Rotel RA-6000, impulse response (one sample at 0dBFS, 44.1kHz sampling, 4ms time window).
Fig.12 Rotel RA-6000, wideband spectrum of white noise at –4dBFS (left channel red, right magenta) and 19.1kHz tone at –3dBFS (left blue, right cyan) with data sampled at 44.1kHz (20dB/vertical div.).
Fig.13 Rotel RA-6000, frequency response at –12dBFS into 100k ohms with data sampled at: 44.1kHz (left channel green, right gray), 96kHz (left cyan, right magenta), and 192kHz (left blue, right red) (1dB/vertical div.).
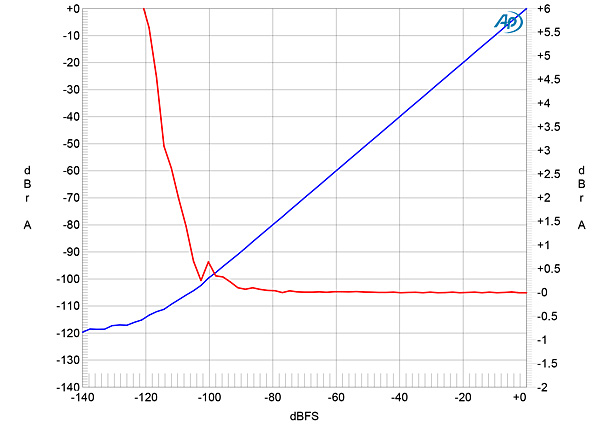
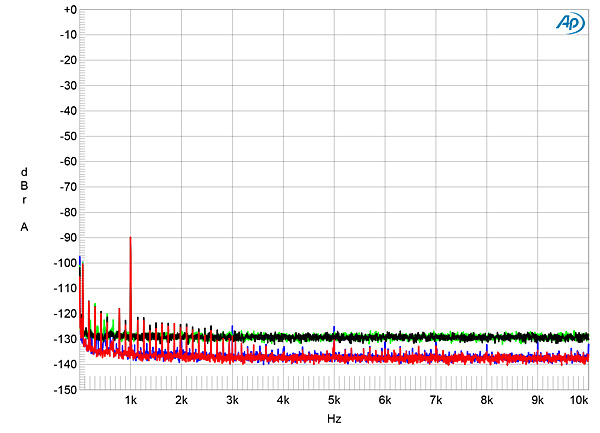
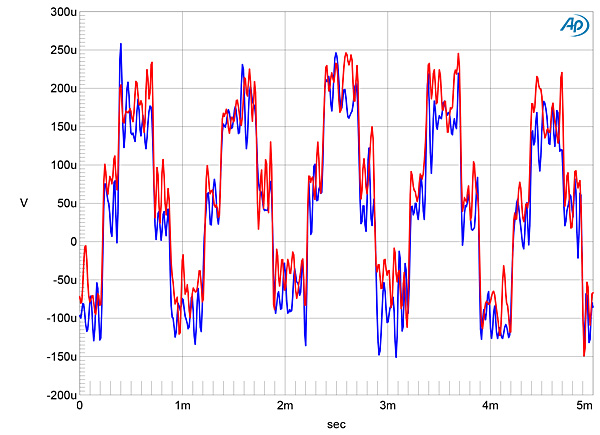
The red trace in fig.14 plots the error in the analog output level as a 24-bit, 1kHz digital tone steps down from 0dBFS to –140dBFS. The amplitude error is negligible until the signal lies below –100dBFS, which implies that the DAC resolution is not significantly greater than 17 bits. This was confirmed by the fact that an increase in bit depth from 16 to 24 with dithered data representing a 1kHz tone at –90dBFS (fig.15) dropped the level of the RA-6000's noisefloor by around 9dB, which implies a resolution between 17 and 18 bits. With undithered data representing a tone at exactly –90.31dBFS, the waveform was symmetrical, with the three DC voltage levels described by the data well resolved (fig.16), though a small DC offset of 50ÊV was present. Repeating the measurement with undithered 24-bit data gave a rather noisy sinewave (also not shown).
Fig.14 Rotel RA-6000, left channel, 1kHz output level vs 24-bit data level in dBFS (blue, 20dB/vertical div.); linearity error (red, 1dB/small vertical div.).
Fig.15 Rotel RA-6000, spectrum with noise and spuriae of dithered 1kHz tone at –90dBFS with: 16-bit TosLink data (left channel green, right gray), 24-bit TosLink data (left blue, right red) (20dB/vertical div.).
Fig.16 Rotel RA-6000, waveform of undithered 1kHz sinewave at –90.31dBFS, 16-bit data (left channel blue, right red).
Fig.17 Rotel RA-6000, 24-bit TosLink data, HF intermodulation spectrum, DC–30kHz, 19+20kHz at –3dBFS into 100k ohms, 44.1kHz data (left channel blue, right red; linear frequency scale).
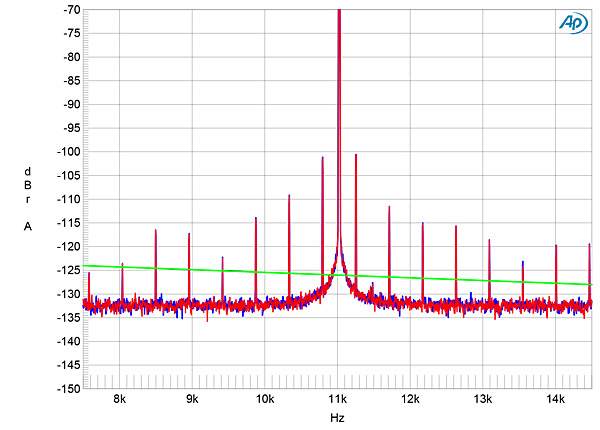
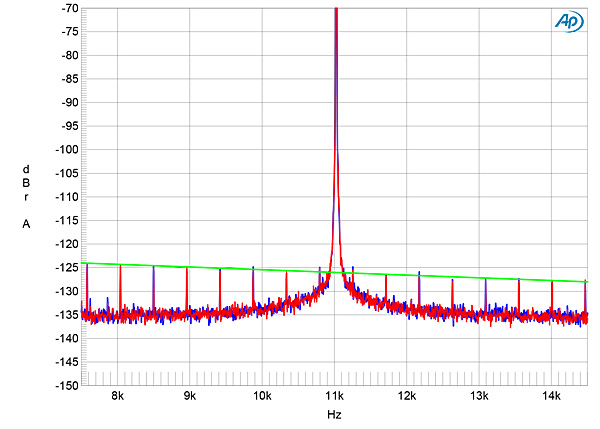
I examined the RA-6000's rejection of word-clock jitter with undithered, 16-bit Miller-Dunn J-Test optical or coaxial data. The odd-order harmonics of the undithered Fs/192, LSB-level squarewave, particularly those at ±229.6875Hz, are higher than the correct levels, these indicated by the sloping green line in fig.18. However, repeating this test with 16-bit J-Test data sent to the RA-6000's USB input gave a much better result (fig.19), as expected, given that the word clock is not embedded in the datastream with this input.
Fig.18 Rotel RA-6000, high-resolution jitter spectrum of analog output signal, 11.025kHz at –6dBFS, sampled at 44.1kHz with LSB toggled at 229.6875Hz: 16-bit TosLink data (left channel blue, right red). Center frequency of trace, 11.025kHz; frequency range, ±3.5kHz.
Fig.19 Rotel RA-6000, high-resolution jitter spectrum of analog output signal, 11.025kHz at –6dBFS, sampled at 44.1kHz with LSB toggled 229.6875Hz: 16-bit USB data (left channel blue, right red). Center frequency of trace, 11.025kHz; frequency range, ±3.5kHz.
To test the Rotel's MM-compatible phono input, I connected a wire from the Audio Precision's ground terminal to the grounding post on the Rotel's rear panel, to obtain the lowest noise. The maximum gain at 1kHz was 49.6dB at the Pre output and 76.1dB at the headphone and the loudspeaker outputs. As with the digital-input testing, I performed all the phono-input testing using the Pre output and, other than S/N ratio, with the volume control set to –12dB in order to avoid the amplifier turning itself off with high-level, high-frequency signals.
Fig.20 Rotel RA-6000, phono input, response with RIAA correction (left channel blue, right red) (1dB/vertical div.).
The wideband, unweighted S/N ratio with the inputs shorted to ground and the volume control set to the maximum was a very good 71dB in both channels, ref. 1kHz at 5mV. Restricting the measurement bandwidth to the audioband increased the ratio to 74dB, while an A-weighting filter further increased the ratio to 80dB. Spectral analysis of the phono input's low-frequency noisefloor revealed very low levels of random noise, but there were power supply-related spuriae present at 60Hz and its odd-order harmonics.
Fig.21 Rotel RA-6000, phono input, spectrum of 1kHz sinewave, DC–1kHz, for 25mV input, measured at preamp output (left channel blue, right red, linear frequency scale).
Fig.22 Rotel RA-6000, phono input, HF intermodulation spectrum, DC–30kHz, 19+20kHz with an input signal 9dB below the overload level (left channel blue, right red; linear frequency scale).


