I relocated the beautiful little P-3A to my listening room, returned to the lab, and looked at what the P-1A was doing in the digital domain. I used the generator board of a dual-board PrismSound DScope II to synthesize a dithered 16-bit 1033Hz sinewave at 0dBFS, and used the analysis board to perform a high-resolution (32,768 points) FFT-derived spectrum of the P-1A's AES/EBU data output. (I averaged 64 spectra to reduce the contribution of random noise.) The blue trace in fig.12 shows the spectrum of the data output by the DScope: the 1033Hz FFT bin in this 1Hz-resolution graph hits the 0dBFS line; the contents of all the other bins more than 6Hz on either side of the tone are below -130dBFS. (If you're wondering how this can be with a 16-bit system, which is supposed to have a maximum signal/noise ratio of 96dB: 96dB is the RMS, or root-mean square, sum of all the -130dBFS components.) The red trace in fig.12 shows the same spectral analysis of the P-1A's digital output with it set to increase the word length to 24 bits. Again, a spectral line can be seen in the 100Hz region at the graph's far left—it is of almost equal level in both the 117 and 118Hz bins—but note the other spectral lines to either side of the 1kHz peak. These would have been hidden by the coarse 1/3-octave bandpass filter used to produce figs.9 and 10. The frequencies of the two highest-level components are 869Hz and 1197Hz; ie, ±164Hz compared with the input signal. The other spuriae are spaced at exactly 164Hz intervals until they sink below the 16-bit noise floor. The floor also appears to be slightly low-pass-filtered just below the CD's original Nyquist frequency of 22.05kHz. 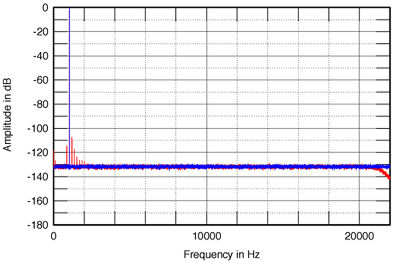 Fig.12 Perpetual Technologies P-1A, high-resolution digital-domain spectrum of dithered 16-bit/1033Hz tone at 0dBFS, original data from DScope II (blue), and via P-1A in Resolution Enhancement mode (red). (20dB/vertical div.)
Unsure if what these graphs revealed were the effects of the Resolution Enhancement algorithm or of some aspect of the P-1A's data handling, I reset the DScope to output a dithered 24-bit tone and repeated the test. Again, the blue trace in fig.13 is the original signal. The noise components now lie at a "roots of the universe" level of -178dBFS, with a regular series of spectral lines around the -170dBFS level resulting from the ultimate mathematical imprecision of the 24-bit data. The red trace shows the effect of the P-1A set to output 24-bit words. The noise floor has risen by 10dB at lower frequencies, more at higher frequencies, which is most likely the effect of the Perpetual unit's own dither. While with one exception the mathematical artifacts are still visible, they are all 10-20dB higher than with the original data. And again, the spectral lines at 1033Hz, ±164Hz and its harmonics can be seen, as the reduction of the noise-floor level unmasks many more components, including a lot of lower-frequency spikes.
Fig.12 Perpetual Technologies P-1A, high-resolution digital-domain spectrum of dithered 16-bit/1033Hz tone at 0dBFS, original data from DScope II (blue), and via P-1A in Resolution Enhancement mode (red). (20dB/vertical div.)
Unsure if what these graphs revealed were the effects of the Resolution Enhancement algorithm or of some aspect of the P-1A's data handling, I reset the DScope to output a dithered 24-bit tone and repeated the test. Again, the blue trace in fig.13 is the original signal. The noise components now lie at a "roots of the universe" level of -178dBFS, with a regular series of spectral lines around the -170dBFS level resulting from the ultimate mathematical imprecision of the 24-bit data. The red trace shows the effect of the P-1A set to output 24-bit words. The noise floor has risen by 10dB at lower frequencies, more at higher frequencies, which is most likely the effect of the Perpetual unit's own dither. While with one exception the mathematical artifacts are still visible, they are all 10-20dB higher than with the original data. And again, the spectral lines at 1033Hz, ±164Hz and its harmonics can be seen, as the reduction of the noise-floor level unmasks many more components, including a lot of lower-frequency spikes. 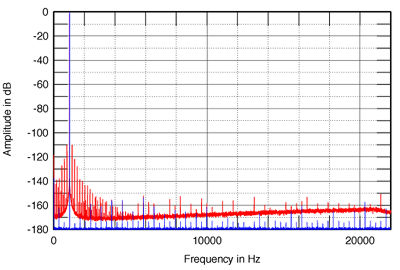 Fig.13 Perpetual Technologies P-1A, high-resolution digital-domain spectrum of dithered 24-bit/1033Hz tone at 0dBFS, original data from DScope II (blue), and via P-1A in Resolution Enhancement mode (red). (20dB/vertical div.) I must admit that I have no idea what this behavior is due to, or if it correlates with RD's finding that Resolution Enhancement sounded a little "veiled" with some CDs. (Remember, all of these added spectral components are still very low in level.) Nor did this behavior change as I reduced the level of the input data.
Puzzled, I turned to the P-1A's and P-3A's jitter performances, using the Miller Audio Research Jitter Analyzer to perform a high-resolution spectral analysis on the P-3A's analog output and feeding the devices being tested data representing an 11.025kHz tone at -6dBFS with the LSB toggling at 229Hz. The source was a low-timebase-error CD-R played on a PS Audio Lambda transport. The solid trace in fig.14 shows the result for the P-3A driven directly from the PSA transport via a 6' length of Apature S/PDIF cable. All the data-related spuriae at ±229Hz and its odd-order harmonics (red numeric markers) are very low in level, and the peak-peak jitter was just 134.2 picoseconds—one of the very lowest levels I have measured. Changing to a TosLink datalink reduced this figure even more, to 133.4ps, due to the disappearance of sidebands at ±15Hz (indicated with purple "1" markers in this graph).
Fig.13 Perpetual Technologies P-1A, high-resolution digital-domain spectrum of dithered 24-bit/1033Hz tone at 0dBFS, original data from DScope II (blue), and via P-1A in Resolution Enhancement mode (red). (20dB/vertical div.) I must admit that I have no idea what this behavior is due to, or if it correlates with RD's finding that Resolution Enhancement sounded a little "veiled" with some CDs. (Remember, all of these added spectral components are still very low in level.) Nor did this behavior change as I reduced the level of the input data.
Puzzled, I turned to the P-1A's and P-3A's jitter performances, using the Miller Audio Research Jitter Analyzer to perform a high-resolution spectral analysis on the P-3A's analog output and feeding the devices being tested data representing an 11.025kHz tone at -6dBFS with the LSB toggling at 229Hz. The source was a low-timebase-error CD-R played on a PS Audio Lambda transport. The solid trace in fig.14 shows the result for the P-3A driven directly from the PSA transport via a 6' length of Apature S/PDIF cable. All the data-related spuriae at ±229Hz and its odd-order harmonics (red numeric markers) are very low in level, and the peak-peak jitter was just 134.2 picoseconds—one of the very lowest levels I have measured. Changing to a TosLink datalink reduced this figure even more, to 133.4ps, due to the disappearance of sidebands at ±15Hz (indicated with purple "1" markers in this graph). 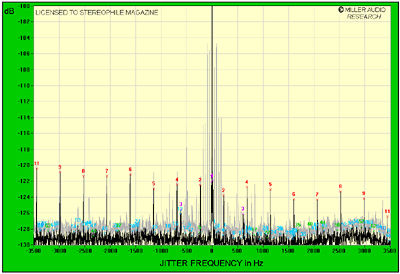 Fig.14 Perpetual Technologies P-3A, high-resolution jitter spectrum of analog output signal (11.025kHz at -6dBFS with LSB toggled at 229Hz, CD data). PS Audio Lambda CD transport connected with 6' Apature S/PDIF cable. Center frequency of trace, 11.025kHz; frequency range, ±3.5kHz. (Grayed-out trace is from PSA Lambda connected with 6' of Apature S/PDIF cable to P-1A, and P-1A connected to P-3A via an I2S Direct link.) I then fed the PSA transport to the P-1A's S/PDIF data input, set the P-1A to upsample to 96kHz and increase the word length to 24 bits, and connected it to the P-3A in I2S Direct mode. The result was the solid trace in fig.15 (also shown, for comparison, as the grayed-out trace in fig.14). I was very surprised to find the situation worse, given RD's enthusiastic recommendation of the combination. Yes, the higher-frequency data-related sidebands have dropped in level, but a slew of sidebands at ±44Hz and its harmonics (purple numeric markers) more than triple the measured jitter level, to 480.3ps. In addition, the noise-floor components have risen by an average 2dB.
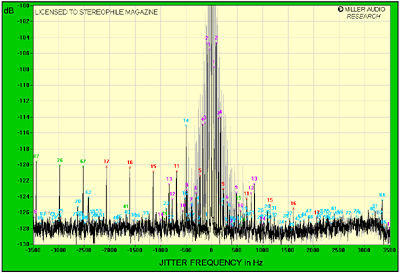 Fig.15 Perpetual Technologies P-3A, high-resolution jitter spectrum of analog output signal (11.025kHz at -6dBFS with LSB toggled at 229Hz, CD data). PS Audio Lambda CD transport connected to P-1A with 6' Apature S/PDIF cable, P-1A connected to P-3A via an I2S Direct link. Center frequency of trace, 11.025kHz; frequency range, ±3.5kHz. (Grayed-out trace is with P-1A connected to P-3A with a 75 ohm S/PDIF link.) Remember that this was with the I
S connection, which should have superior jitter rejection due to its carrying the wordclock signal on a separate wire. Replacing the I2S link between the two Perpetual units with a 75 ohm S/PDIF link gave the grayed-out trace in fig.15. A mass of closely spaced (20Hz) sidebands can be seen, and the jitter level has increased by a factor of 50 times, to 15,610ps, or 15.6 nanoseconds! The P-3A is one of the best-measuring D/A converters I have encountered, particularly regarding dynamic range, resolution, and linearity. This is a tribute both to the P-3A's design team and to Cirrus Logic, which makes the chipset used in the unit. That the P-3A costs just $699 makes it astounding value for money. Given RD's very positive auditioning of the P-1A and P-3A, I cannot believe that the perverse measured performance I obtained for the P-1A is typical of what Perpetual Technologies intended. I have therefore requested a second sample and will report on its behavior in a Follow-Up.—John Atkinson
Fig.12 Perpetual Technologies P-1A, high-resolution digital-domain spectrum of dithered 16-bit/1033Hz tone at 0dBFS, original data from DScope II (blue), and via P-1A in Resolution Enhancement mode (red). (20dB/vertical div.) Fig.13 Perpetual Technologies P-1A, high-resolution digital-domain spectrum of dithered 24-bit/1033Hz tone at 0dBFS, original data from DScope II (blue), and via P-1A in Resolution Enhancement mode (red). (20dB/vertical div.) I must admit that I have no idea what this behavior is due to, or if it correlates with RD's finding that Resolution Enhancement sounded a little "veiled" with some CDs. (Remember, all of these added spectral components are still very low in level.) Nor did this behavior change as I reduced the level of the input data. Fig.14 Perpetual Technologies P-3A, high-resolution jitter spectrum of analog output signal (11.025kHz at -6dBFS with LSB toggled at 229Hz, CD data). PS Audio Lambda CD transport connected with 6' Apature S/PDIF cable. Center frequency of trace, 11.025kHz; frequency range, ±3.5kHz. (Grayed-out trace is from PSA Lambda connected with 6' of Apature S/PDIF cable to P-1A, and P-1A connected to P-3A via an I2S Direct link.) I then fed the PSA transport to the P-1A's S/PDIF data input, set the P-1A to upsample to 96kHz and increase the word length to 24 bits, and connected it to the P-3A in I2S Direct mode. The result was the solid trace in fig.15 (also shown, for comparison, as the grayed-out trace in fig.14). I was very surprised to find the situation worse, given RD's enthusiastic recommendation of the combination. Yes, the higher-frequency data-related sidebands have dropped in level, but a slew of sidebands at ±44Hz and its harmonics (purple numeric markers) more than triple the measured jitter level, to 480.3ps. In addition, the noise-floor components have risen by an average 2dB. Fig.15 Perpetual Technologies P-3A, high-resolution jitter spectrum of analog output signal (11.025kHz at -6dBFS with LSB toggled at 229Hz, CD data). PS Audio Lambda CD transport connected to P-1A with 6' Apature S/PDIF cable, P-1A connected to P-3A via an I2S Direct link. Center frequency of trace, 11.025kHz; frequency range, ±3.5kHz. (Grayed-out trace is with P-1A connected to P-3A with a 75 ohm S/PDIF link.) Remember that this was with the I