| Columns Retired Columns & Blogs |
Musical Fidelity M3 Nu-Vista integrated amplifier Measurements
Sidebar 3: Measurements
After the one-hour preconditioning period at one-third power, the M3's side-mounted heatsinks were only just too hot to touch. The chassis was warm, however. The maximum voltage gain for line-level sources (8 ohm load) was a high 44dB; 14dB of this was from the line-preamp section. The amplifier didn't invert signal polarity and the input impedance was very high at more than 500k ohms—too high for me to get anything other than an approximate measurement. (Unless otherwise noted, all measurements are for line-level inputs.)
The preamp output impedance was a low 48 ohms; the power-amplifier output impedance was a very low 0.075 ohm across most of the audioband, rising to 0.13 ohm at 20kHz. As a result, there will be very little modification of the amplifier's frequency response resulting from interaction between its source impedance and the manner in which the partnering speaker's impedance changes with frequency.
This can be seen in fig.1, which also shows the small-signal response into 8 and 4 ohm resistive loads. The amplifier rolls off slightly in the extreme highs, reaching -0.5dB at 20kHz, which slows down the edges of a 10kHz squarewave (fig.2). The traces in fig.1 were taken with the volume control at 12:00; note the 0.3dB channel imbalance at this setting.
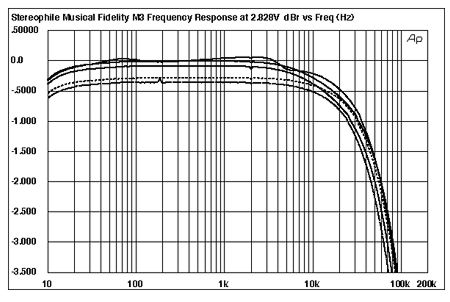
Fig.1 Musical Fidelity M3 Nu-Vista, frequency response at (from top to bottom at 2kHz): 2.83V into dummy loudspeaker load, 1W into 8 ohms, and 2W into 4 ohms (0.5dB/vertical div.).
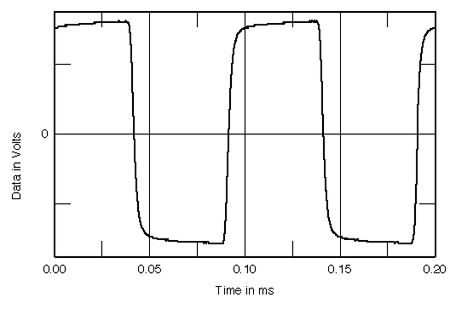
Fig.2 Musical Fidelity M3 Nu-Vista, small-signal 10kHz squarewave into 8 ohms.
The channels were perfectly matched with the volume control at its maximum position. Channel separation measured at the speaker outputs (fig.3) was good in the L-R direction but disappointing in the other direction, at just 45dB. Closer investigation revealed that this crosstalk was occurring in the preamplifier section, the power-amplifier separation being very much better in this regard.
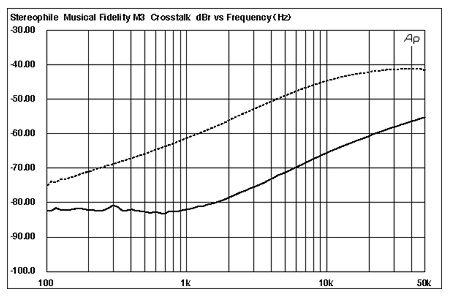
Fig.3 Musical Fidelity M3 Nu-Vista, channel separation (10dB/vertical div., R-L dashed).
Harmonic distortion levels were very low (fig.4), at around 0.03% across most of the band (THD+noise). The figure did rise slightly into 2 ohms and a little more so above the audioband, as can be seen in this graph. However, most of the measured figure at lower frequencies is actually due to noise, and I had to raise the output level to 199W and drop the load to 4 ohms to get a sensible THD waveform (fig.5). The distortion is predominantly the subjectively benign second harmonic, and even at this very high power level, the measured THD figure was still just 0.013%! One peculiar aspect of the fig.4 traces is that the highest distortion occurred into our simulated loudspeaker load, which suggests the M3 is less happy with reactive loads than other high-end amplifiers. Nevertheless, given the Musical Fidelity's very high output power, I don't believe this will be a real-world problem.
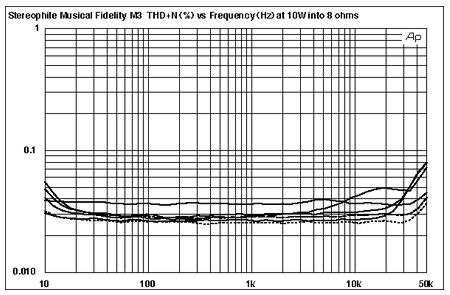
Fig.4 Musical Fidelity M3 Nu-Vista, THD+noise (%) vs frequency at (from top to bottom at 10kHz): 2.83V into simulated loudspeaker load, 4W into 2 ohms, 2W into 4 ohms, and 1W into 8 ohms.
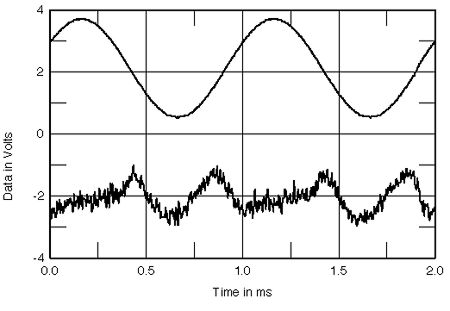
Fig.5 Musical Fidelity M3 Nu-Vista, 1kHz waveform at 199W into 4 ohms (top), distortion and noise waveform with fundamental notched out (bottom, not to scale).
Looking at the distortion spectrum with a low-frequency sinewave (fig.6), this indicated that doubling the power to 400W into 4 ohms gave a second harmonic at just -90dB (0.003%). The highest-level spurious tone in this graph is actually the 120Hz AC supply component at -84dB (0.006%). At a lower 200W output level, this component dropped almost to 100dB down from peak level; its rise at 400W (both channels driven) is really the only indication of how hard the amplifier is working! Levels of intermodulation distortion were similarly minuscule, even with the amplifier just below the clipping point with the demanding mix of 19kHz and 20kHz tones (fig.7).
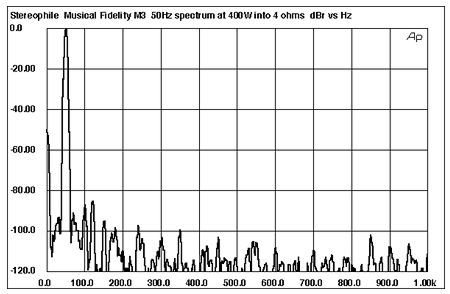
Fig.6 Musical Fidelity M3 Nu-Vista, spectrum of 50Hz sinewave, DC-1kHz, at 400W into 4 ohms (linear frequency scale).
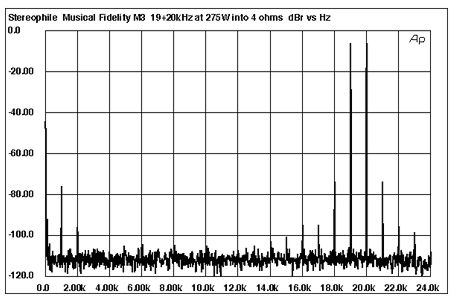
Fig.7 Musical Fidelity M3 Nu-Vista, HF intermodulation spectrum, DC-24kHz, 19+20kHz at 275W into 4 ohms (linear frequency scale).
With continuous drive and both channels operating (fig.8), the Musical Fidelity M3 more than met its specification, with 310W of clipping power available into 8 ohms (24.9dBW). (Clipping is traditionally defined as 1% THD.) This increased to 520W into 4 ohms (24.1dBW) and 800W into 2 ohms (23dBW), the latter figure with just one channel driven. This graph reveals such high power delivery, especially for an integrated amplifier, that it is unlikely that anyone who buys an M3 will ever clip it. Something that might not be a real-world issue, therefore, is that when the amplifier did clip, it didn't do so gracfeully and it also took a couple of seconds to recover when the drive signal was subsequently reduced.
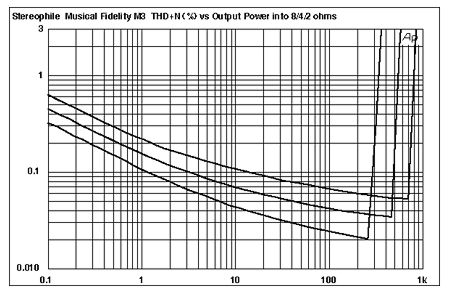
Fig.8 Musical Fidelity M3 Nu-Vista, distortion (%) vs continuous output power into (from bottom to top at 10W): 8 ohms, 4 ohms, and 2 ohms.
Driving one channel of the amplifier with a low-duty-cycle 1kHz toneburst (fig.9), to get a handle on how it behaves with transient-rich music rather than continuous sinewaves, I raised an astounding 402W into 8 ohms (black trace) and 734W into 4 ohms (red). Into 2 ohms, however, as revealed by the blue trace in this graph, the Musical Fidelity's protection circuitry cut in at 925W! I repeated this test with the same result, but the amplifier then went into thermal protection, meaning I couldn't test it into 1 ohm.
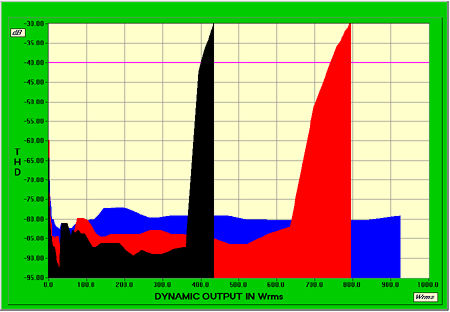
Fig.9 Musical Fidelity M3 Nu-Vista, distortion (%) vs 1kHz burst output power into 8 ohms (black trace), 4 ohms (red), and 2 ohms (blue).
The phono input uses a circuit based on a high-quality op-amp (the top of the chip is painted black, but, knowing Antony Michaelson's love of the NE5534 family of devices, I would hazard a guess to its identity) following a matched pair of transistors. The phono input impedance as supplied was 37.3k ohms, and the maximum gain with the internal DIP switches in the moving-magnet position measured a high 53.6dB. In moving-coil mode, the gain was 70.5dB, which I thought might be too high for MC cartridges with outputs higher than a couple of hundred microvolts. I shouldn't have worried. The downstream nuvistors endow the preamp with enormous dynamic range—while exploring the phono stage's overload performance, I saw levels of greater than 50V at the preamp outputs. (A good thing I'd powered down and disconnected the power-amplifier stages while doing the phono input measurements!)
In the MM position, the overload margins varied from 28dB at 20Hz to 24.5dB at 20kHz, both figures excellent. In the MC position, the exact overload point was harder to assess due to the presence of noise, but it appeared to be a superb 30dB or above over much of the audioband, decreasing to a still-adequate 20dB or so at 20kHz. The RIAA error, measured at the preamplifier outputs, is shown in fig.10; it slopes gently down through the treble, reaching -1dB at 20kHz, with the right channel showing a little more top-octave extension.
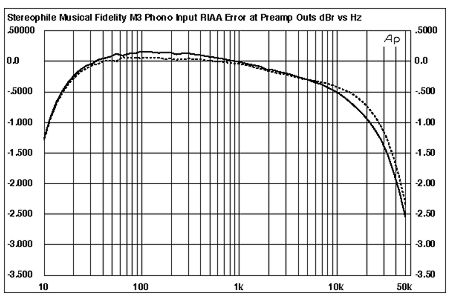
Fig.10 Musical Fidelity M3 Nu-Vista, phono stage RIAA error, measured at preamp outputs into 100k ohms (0.5dB/vertical div.).
Considered purely on a watts-per-dollar basis, the M3 Nu-Vista offers great value. But its measured performance reveals no compromises that can be laid at the door of its being an integrated amplifier rather than separates, or to its use of nuvistor tubes in its line stage.—John Atkinson
- Log in or register to post comments
