Sidebar 3: Measurements
Because of the Magico A5's bulk and weight, I drove my test gear to Jim Austin's apartment to perform the measurements in situ. As always, I used DRA Labs' MLSSA system, an Earthworks microphone preamplifier, and a calibrated DPA 4006 microphone to measure the Magico A5's behavior in the farfield. (We maneuvered one of the 180lb speakers, serial number 000407, onto a dolly and rolled it so it fired across a room diagonal and was maximally distant from the sidewalls.) I used an Earthworks QTC-40 mike for the nearfield and spatially averaged in-room responses. (For the latter, the loudspeakers were in the positions where JCA had auditioned them.)
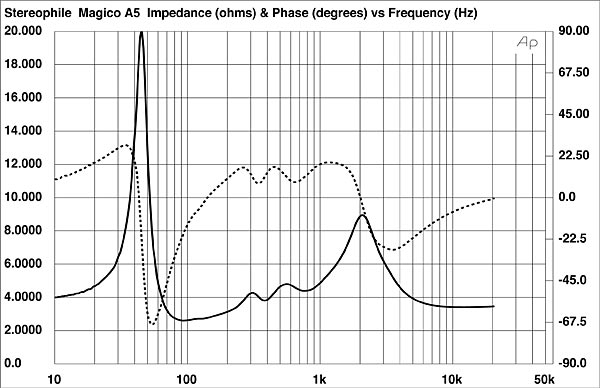
Magico specifies the A5's sensitivity as 88dB for 2.83V at 1m. My estimate was slightly lower, at 86.5dB(B)/2.83V/m. The A5's impedance is specified as 4 ohms. Using Dayton Audio's DATS V2 system, I found that the impedance magnitude (fig.1, solid trace) did average around 4 ohms, with a minimum value of 2.6 ohms at 93Hz. The electrical phase angle (dashed trace) is occasionally high when the magnitude is low. For example, there is a combination of 3.4 ohms and –50° at 70Hz, a frequency where music can have high levels of energy. The EPDR 1 drops below 2 ohms between 53Hz and 120Hz, with a minimum value of 1 ohm at 70Hz. The A5 must be used with amplifiers that don't have problems driving 2 ohm loads.
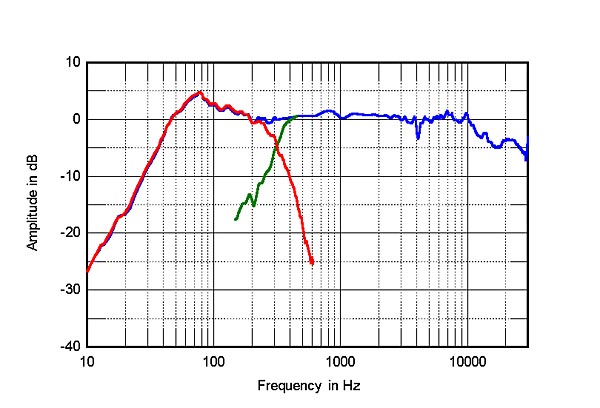 The blue trace below 420Hz in fig.3 is the complex sum of the nearfield midrange and woofer responses. Above 420Hz, the blue trace in fig.3 shows the A5's farfield response, averaged across a 30° horizontal window centered on the tweeter axis. Other than a very narrow suckout at 4kHz that will be very difficult to hear (footnote 2), the response is superbly flat and even up to 10kHz. The gentle downward slope above that frequency might have contributed to my estimate of the loudspeaker's sensitivity being slightly lower than the specification. As with the Magico M2 that I reviewed in February 2020 and JCA reviewed in March 2021, the use of a pistonic tweeter with a high-Q ultrasonic dome response results in a lack of energy in the region below that resonance.
Fig.4 shows the A5's horizontal dispersion, normalized to the response on the tweeter axis, which thus appears as a straight line. (The physical limitations of performing the measurements in JCA's room restricted the off-axis measurements to 45° to the sides rather than my usual 90°.) The loudspeaker's radiation pattern is smooth and even, though with a slight excess of energy to the sides in the presence region and a slight lack of energy off-axis above that region. The tweeter doesn't become as directional in its top audio octave as I was anticipating from my measurements of the M2.
The blue trace below 420Hz in fig.3 is the complex sum of the nearfield midrange and woofer responses. Above 420Hz, the blue trace in fig.3 shows the A5's farfield response, averaged across a 30° horizontal window centered on the tweeter axis. Other than a very narrow suckout at 4kHz that will be very difficult to hear (footnote 2), the response is superbly flat and even up to 10kHz. The gentle downward slope above that frequency might have contributed to my estimate of the loudspeaker's sensitivity being slightly lower than the specification. As with the Magico M2 that I reviewed in February 2020 and JCA reviewed in March 2021, the use of a pistonic tweeter with a high-Q ultrasonic dome response results in a lack of energy in the region below that resonance.
Fig.4 shows the A5's horizontal dispersion, normalized to the response on the tweeter axis, which thus appears as a straight line. (The physical limitations of performing the measurements in JCA's room restricted the off-axis measurements to 45° to the sides rather than my usual 90°.) The loudspeaker's radiation pattern is smooth and even, though with a slight excess of energy to the sides in the presence region and a slight lack of energy off-axis above that region. The tweeter doesn't become as directional in its top audio octave as I was anticipating from my measurements of the M2.
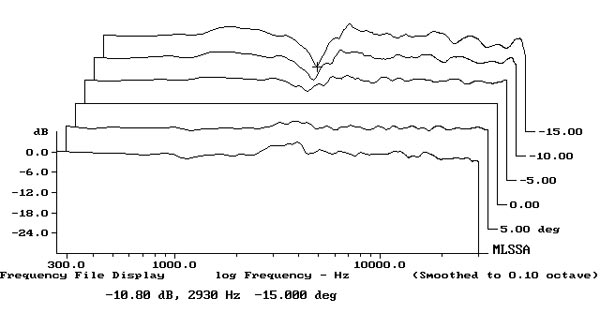
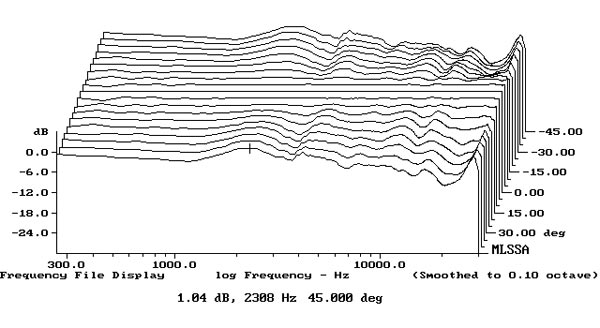 Fig.5 shows the Magico's vertical dispersion, again normalized to the response on the tweeter axis, which is 41" from the floor. Usefully, the response 5° below the tweeter axis, which will be close to JCA's listening axis, is similar to the tweeter-axis response. The usual off-axis suckout in the crossover between the midrange unit and tweeter doesn't make its presence known until 10° above the tweeter axis. Don't listen to this speaker while standing.
Footnote 1: EPDR is the resistive load that gives rise to the same peak dissipation in an amplifier's output devices as the loudspeaker. See "Audio Power Amplifiers for Loudspeaker Loads," JAES, Vol.42 No.9, September 1994, and stereophile.com/reference/707heavy/index.html. Footnote 2: Unlike Magico's M2, which has a baffle with smoothly rounded edges, the A5 has a sharp-edged baffle. This will result in reflections from the tweeter's output that will interfere destructively with the output when the distance between the tweeter and the edges is an odd number of half wavelengths. The wavelength at 4kHz is 3.4" and the distance between the center of the tweeter dome and the edges of the baffle to its sides is 5.25", ie, very close to three half wavelengths at this frequency. Footnote 3: Using MLSSA, I averaged 20 1/10-octave–smoothed power spectra, individually taken for the left and right speakers, in a rectangular grid 36" wide by 18" high and centered on the positions of Jim Austin's ears.
Footnote 4: The subsonic noise from the system's intermittent fan, while not high in level, is loud enough to render serious, analytical listening difficult or impossible. The fan operates for hours at a time during the coldest weather but far less when it's warmer. It's turned off completely between early May and late October. JA's measurements were performed on a cold morning at the end of March.—Jim Austin
Fig.1 Magico A5, electrical impedance (solid) and phase (dashed) (2 ohms/vertical div.).
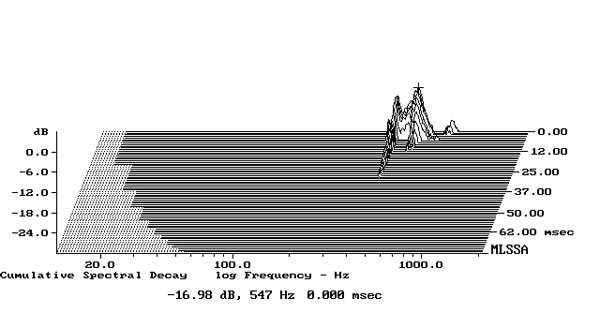
The traces in fig.1 are free from the small discontinuities that would imply that there are resonances of some kind present. When I investigated the enclosure's vibrational behavior with a plastic-tape accelerometer, I did find some resonant modes on the sidewalls and top panel, at 422Hz and 547Hz (fig.2), but these are at such low levels that they will not have any audible consequences.
Fig.2 Magico A5, cumulative spectral-decay plot calculated from output of accelerometer fastened to top panel (MLS driving voltage to speaker, 7.55V; measurement bandwidth, 2kHz).
The single peak centered on 45Hz in the impedance magnitude trace suggests that this is the sealed-box tuning frequency of the woofers, which corresponds to the frequency where the anechoic response is down by 6dB. While their summed nearfield output (fig.3, red trace; the three woofers appear to behave identically) peaks a little higher in frequency than the tuning frequency, the excess of energy between 200Hz and 50Hz will be an artifact of the nearfield measurement. (This assumes that the radiators are mounted in a true infinite baffle, ie, one that extends to infinity in both planes.) The woofers' upper-frequency rolloff is clean, before crossing over to the midrange unit around 300Hz with symmetrical high-order slopes.
Fig.3 Magico A5, anechoic response on tweeter axis at 50", averaged across 30° horizontal window and corrected for microphone response, with the nearfield responses of the midrange unit (green) and woofers (red), and their complex sum (blue), respectively plotted below 420Hz, 600Hz and 420Hz.
Fig.4 Magico A5, lateral response family at 50", normalized to response on tweeter axis, from back to front: differences in response 45–5° off axis, reference response, differences in response 5–45° off axis.
Fig.5 Magico A5, vertical response family at 50", normalized to response on tweeter axis, from back to front: differences in response 15–5° above axis, reference response, differences in response 5–10° below axis.
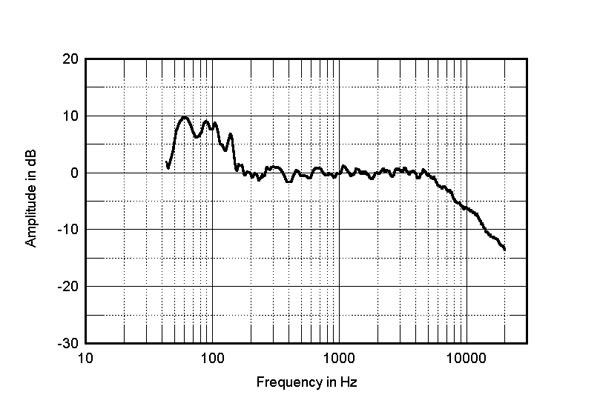
Fig.6 shows the Magico A5s' 1/10 octave-smoothed, spatially averaged response in Jim Austin's room. (The spatial averaging (footnote 3) tends to average out the peaks and dips below 400Hz that are due to the room's resonant modes.) I have not shown the in-room response below 45Hz, as this was affected by the presence of subsonic noise from his building's heating/ ventilation system. This could not be turned off on the morning that I was able to perform the measurements (footnote 4). The noise did not affect the farfield and nearfield measurements shown in figs.3–5, which were made with windowed impulse responses, but did affect the power spectra I measured to create fig.6.
Fig.6 Magico A5, spatially averaged, 1/10-octave response in JCA's listening room.
Other than an excess of energy in-room between 45Hz and 150Hz, which I suspect will be due to the Magicos exciting the low-frequency modes in JCA's room, the balance at the listening position is impressively even, meeting ±1.4dB limits between 180Hz and 5kHz. I can't recall measuring an in-room response this good! The A5s' output in the top two octaves smoothly slopes down, but as I have written before, a loudspeaker that offers a flat on-axis response and well-controlled lateral dispersion does give a gently sloped-down treble in the spatially averaged room response. This is primarily due to the increased absorption of the room's furnishings and the contribution from the loudspeaker's power response. (A speaker that has a flat measured top-octave output in an in-room measurement will sound as if the highs are tilted up.)
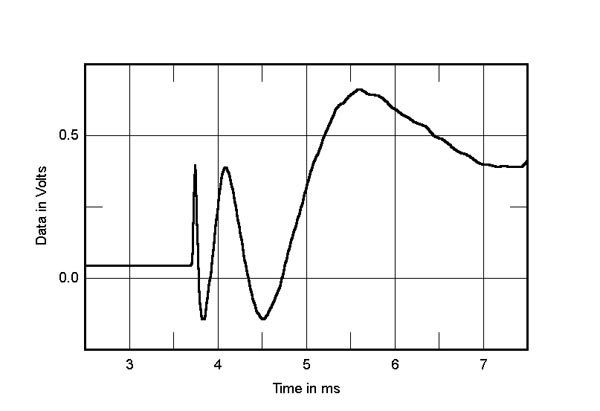
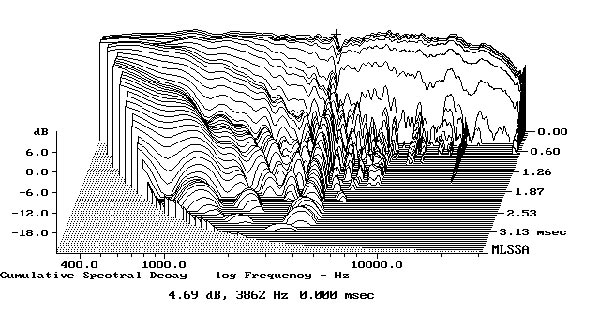
In the time domain, the A5's step response on the tweeter axis (fig.7) reveals that the tweeter, midrange unit, and woofers are all connected in positive acoustic polarity. The decay of the tweeter's step smoothly blends with the positive-going start of the midrange unit's step, and the decay of the midrange unit's step blends smoothly with the positive-going start of the woofers' step. This implies optimal implementation of the crossover. (The apparent DC offset in this graph is due to the fact that calculating the loudspeaker's step response from the measured impulse response integrates the subsonic noise.) Other than a narrow ridge of delayed energy at the frequency of the narrow suckout in the farfield response, the A5's cumulative spectral-decay plot (fig.8) is clean.
Fig.7 Magico A5, step response on tweeter axis at 50" (5ms time window, 30kHz bandwidth).
Fig.9 Magico A5, cumulative spectral-decay plot on tweeter axis at 50" (0.15ms risetime).
As with the other Magico loudspeakers that have been reviewed in Stereophile, the A5's measured performance indicates excellent audio engineering.—John Atkinson
Footnote 1: EPDR is the resistive load that gives rise to the same peak dissipation in an amplifier's output devices as the loudspeaker. See "Audio Power Amplifiers for Loudspeaker Loads," JAES, Vol.42 No.9, September 1994, and stereophile.com/reference/707heavy/index.html. Footnote 2: Unlike Magico's M2, which has a baffle with smoothly rounded edges, the A5 has a sharp-edged baffle. This will result in reflections from the tweeter's output that will interfere destructively with the output when the distance between the tweeter and the edges is an odd number of half wavelengths. The wavelength at 4kHz is 3.4" and the distance between the center of the tweeter dome and the edges of the baffle to its sides is 5.25", ie, very close to three half wavelengths at this frequency. Footnote 3: Using MLSSA, I averaged 20 1/10-octave–smoothed power spectra, individually taken for the left and right speakers, in a rectangular grid 36" wide by 18" high and centered on the positions of Jim Austin's ears.