Sidebar 3: Measurements
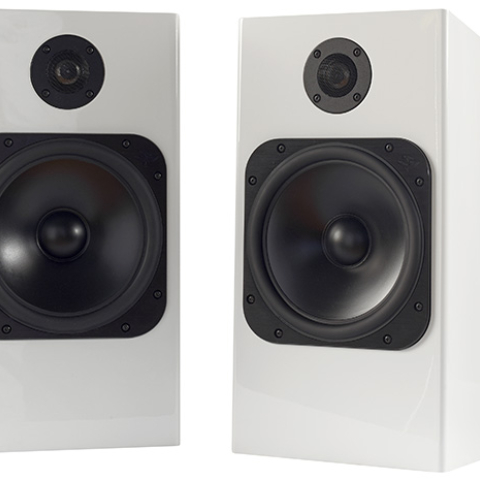
I used DRA Labs' MLSSA system and a calibrated DPA 4006 microphone to measure the KEF LS50's frequency response in the farfield, and an Earthworks QTC-40 for the nearfield and spatially averaged room responses. My estimate of the LS50 Meta's voltage sensitivity was 84.5dB(B)/2.83V/m, which is the same as that of the original LS50 and within experimental error of the specified 85dB.
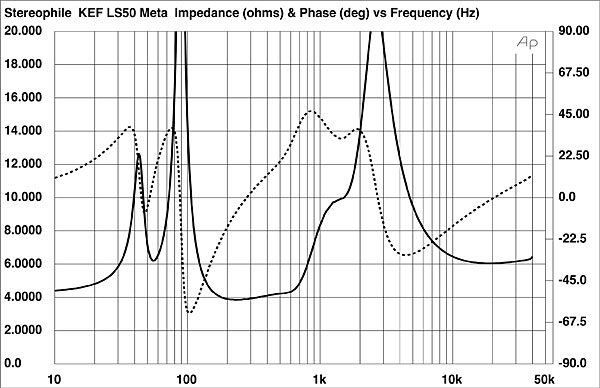
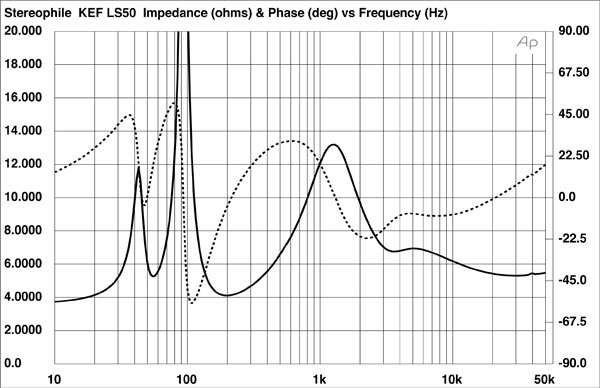
The solid trace in fig.1 shows how the Meta's impedance magnitude varies with frequency. Below 200Hz, it is almost identical to that of the 2012 LS50 (fig.2, solid trace), but at higher frequencies the impedance traces are quite different. The Meta remains closer to 4 ohms for longer in the midrange but has a considerably higher magnitude in the crossover region. The new speaker's electrical phase angle (fig.1, dashed trace) is occasionally high, and I used the formula in a 1994 JAES paper to calculate the "equivalent peak dissipation resistance" (EPDR, footnote 1). The LS50 Meta has minimum EPDRs of 1.66 ohms between 135Hz and 140Hz and 1.7 ohms between 660Hz and 725Hz, both regions where music can have high energy. The partnering amplifier needs to be comfortable driving 4 ohms.
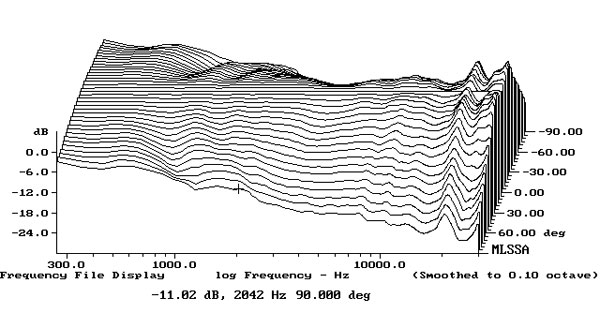
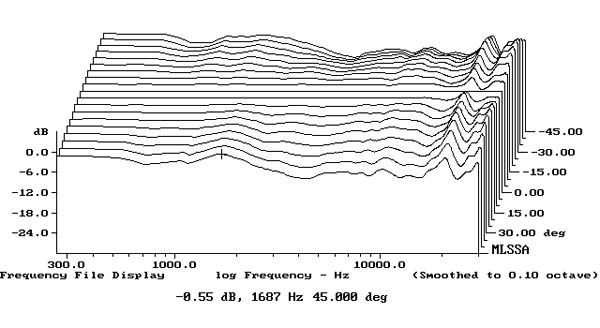
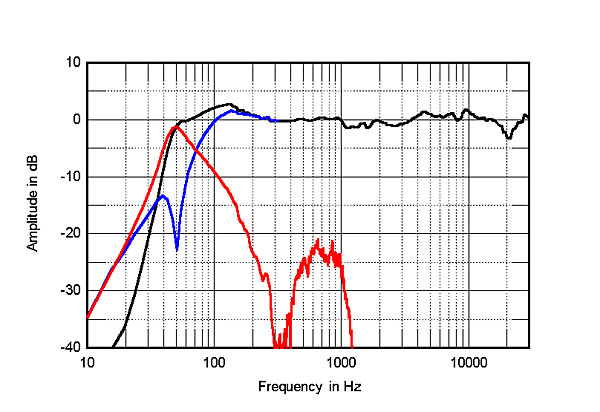 The LS50 Meta's farfield output, averaged across a 30° horizontal window centered on the tweeter axis (fig.4, black trace above 300Hz), is superbly even from the lower midrange through the treble—better, in fact than that of the original version. The tweeter's output remains at full level almost to the 20kHz limit of this graph. As with other recent loudspeakers from KEF that use the coaxial Uni-Q drive-unit, including the earlier LS50, there are no discontinuities in the mid-treble that might be due to destructive interference between the direct radiation from the tweeter and reflections of that radiation from the circumference of the woofer cone. The Meta's dispersion, like that of the original LS50, is very uniform in both horizontal (fig.5) and vertical (fig.6) planes, with well-controlled narrowing of the radiation pattern in the top octaves.
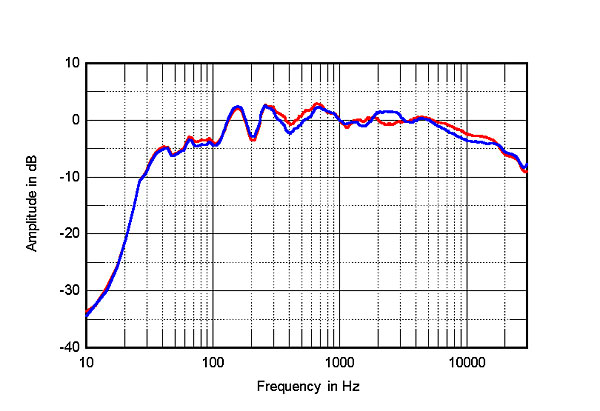
 The LS50 Meta's spatially averaged response in my listening room is shown as the red trace in fig.7. (I average 20 1/6-octave–smoothed spectra, taken for the left and right speakers individually with a 96kHz sample rate, in a vertical rectangular grid 36" wide by 18" high and centered on the positions of my ears. This largely eliminates the room acoustics' effects and integrates the direct sound of the speakers with the in-room energy to give a curve that I have found correlates reasonably well with a speaker's perceived tonal balance.) For reference, the blue trace in fig.7 shows the original LS50's spatially averaged response with the speakers in exactly the same positions as the Metas.
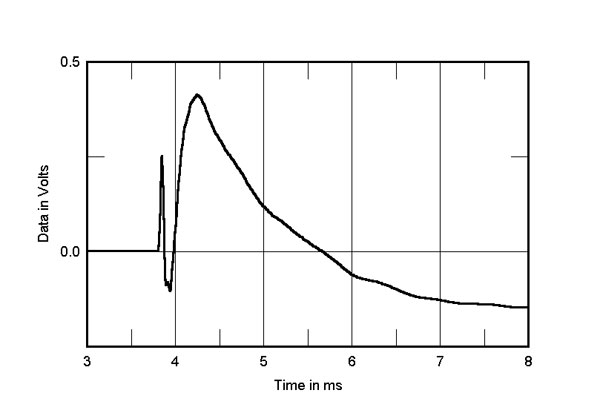
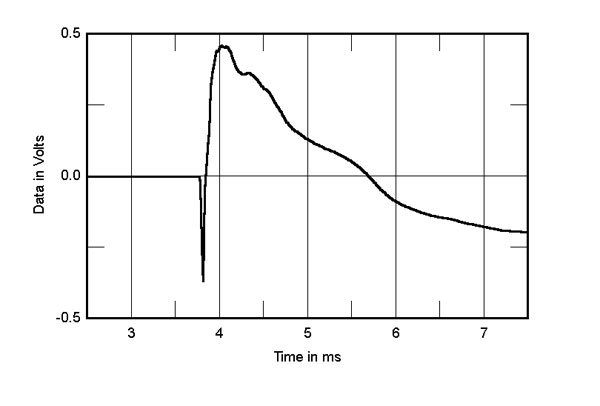
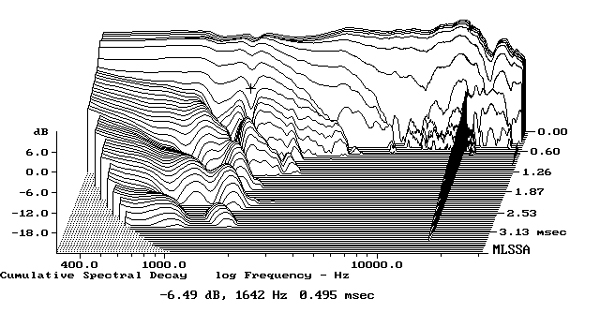
 Turning to the time domain, the LS50 Meta's step response on the Uni-Q axis (fig.8) indicates that the tweeter and woofer are both connected in positive acoustic polarity, with the tweeter's output arriving first at the microphone. This is different from the original LS50, where the tweeter was connected in negative polarity (fig.9). In both cases, the decay of the tweeter's step smoothly integrates with the start of the woofer's step, which implies optimal crossover design. Like the Anniversary Edition LS50, the LS50 Meta's cumulative spectral-decay plot on the tweeter axis (fig.10) features astonishingly clean decay at all frequencies. (Ignore the black ridge of delayed energy just below 16kHz in this graph, which is due to interference from the computer's video-display circuitry.)
Footnote 1: EPDR is the resistive load that gives rise to the same peak dissipation in an amplifier's output devices as the loudspeaker. See "Audio Power Amplifiers for Loudspeaker Loads" by Eric Benjamin, JAES, Vol.42 No.9, September 1994, and Keith Howard's article here.
Fig.1 KEF LS50 Meta, electrical impedance (solid) and phase (dashed) (2 ohms/vertical div.).
Fig.2 KEF LS50 (original), electrical impedance (solid) and phase (dashed) (2 ohms/vertical div.).
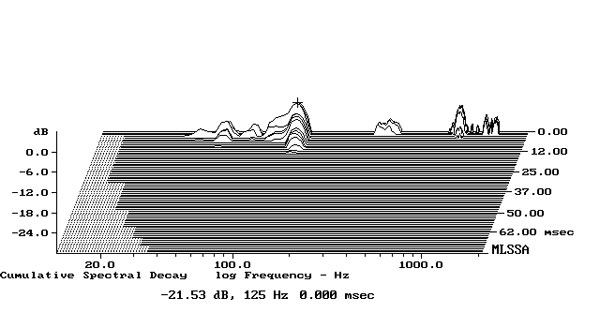
The traces in fig.1 are free from the small discontinuities that would suggest the presence of cabinet resonances. Cumulative spectral-decay plots of the cabinet walls' vibrational behavior, calculated from the output of a plastic-tape accelerometer, confirmed that the enclosure was effectively inert (fig.3), even more so than the original, which had performed well on this test.
Fig.3 KEF LS50 Meta, cumulative spectral-decay plot calculated from output of accelerometer fastened to center of side panel (MLS driving voltage to speaker, 7.55V; measurement bandwidth, 2kHz).
The port is tuned to 51Hz, confirmed by the minimum-motion notch at that frequency in the woofer's nearfield output (fig.4, blue trace). The port's nearfield response (red trace) peaks sharply between 40 and 70Hz, and though some upper-frequency output is visible, this is well down in level. The behavior of the woofer and port is effectively identical to that of the original LS50.
Fig.4 KEF LS50 Meta, anechoic response on HF axis at 50", averaged across 30° horizontal window and corrected for microphone response, with nearfield responses of woofer (blue) and port (red) and their complex sum (black), respectively plotted below 312Hz, 1kHz, 312Hz.
Fig.5 KEF LS50 Meta, lateral response family at 50", normalized to response on tweeter axis, from back to front: differences in response 90–5° off axis, reference response, differences in response 5–90° off axis.
Fig.6 KEF LS50 Meta, vertical response family at 50", normalized to response on tweeter axis, from back to front: responses 45–5° above axis, reference response, responses 5–45° below axis.
Fig.7 KEF LS50 Meta, spatially averaged, 1/6-octave response in JA's listening room (red), and of original LS50 (blue).
The two models offer identical in-room responses below 300Hz. There are two small peaks and dips that have not been eliminated by the spatial averaging, and the midbass region is shelved down, though the extension is helped by the lowest-frequency mode in my listening room. Both the LS50s and LS50 Metas would have benefited from being placed closer to the wall behind them than is possible in my room. Both speakers have a little too much in-room energy in the upper midrange, but the Meta's response is flatter in the presence region and there is a little more output in the high treble than with the Anniversary Edition. The top two audio octaves slope down with both models, due both to the increased absorption of the room furnishings and the speakers' increasing directivity in this region.
Fig.8 KEF LS50 Meta, step response on HF axis at 50" (5ms time window, 30kHz bandwidth).
Fig.9 KEF LS50 (original), step response on HF axis at 50" (5ms time window, 30kHz bandwidth).
Fig.10 KEF LS50 Meta, cumulative spectral-decay plot on HF axis at 50" (0.15ms risetime).
This is superb measured performance, even without taking into consideration the LS50 Meta's affordable price.—John Atkinson
Footnote 1: EPDR is the resistive load that gives rise to the same peak dissipation in an amplifier's output devices as the loudspeaker. See "Audio Power Amplifiers for Loudspeaker Loads" by Eric Benjamin, JAES, Vol.42 No.9, September 1994, and Keith Howard's article here.