Sidebar 4: Measurements
Logistical issues meant that I measured different samples of the Infigo Method 3, serial numbers 3022-0002 and 3022-0003, than those auditioned by JVS. I started the testing with sample '0003, using my Audio Precision SYS2722 system. Initially, I used a balanced connection between the Audio Precision's signal generator and the Method 3. I preconditioned the amplifier following the CEA's recommendation, operating it at one-eighth the maximum power into 8 ohms for 30 minutes prior to testing. At the end of that time, the right-hand heatsink was warm, at 101.8°F (38.8°C), but the left-hand heatsink was at room temperature (see later).
Then I encountered problems: I saw bursts of high-frequency noise coinciding with the waveform peaks; these bursts went away when the XLR ground (pin 1) was floated. But with the ground floated, the Method 3's frequency response resembled that of a high-pass filter, rolling off below 3kHz with a first-order, 6dB/octave slope, and the voltage gain into 8 ohms was 8dB lower than the specified 26dB. With pin 1 grounded, the gain rose by 2dB, but it was still 6dB lower than specified.
Informed of these issues, Infigo's Hans Looman responded that pin 1 of the cable's balanced XLR plugs must be connected to ground. If that wasn't the case, the high-pass response with the balanced connection was due to "the signal ground connection being via ground capacitors only." This would explain the high-pass behavior. As for the HF bursts, they "could have been the result [of] the way the shield in the cable may not have played nice in this particular connection when there are ground issues already." He added that although there are heatsinks on both sides of the chassis, the current version of the Method 3 is equipped with circuit boards on only one side. "If you look inside, you can see that the non-assembled side (the left one as seen from the front) has a milled-out section in the heatsink that can also hold a board, similar to the one in the right heatsink. The original concept was to have the amplifier work either in bridge or biamp mode to drive the two sets of binding posts. Because of this, the leftover half acts basically as a single-ended input mode on the XLR connector, with pin 2 as the hot connection for that side and pin 1 as signal ground."
The 6dB shortfall with the balanced connection was likely due to the XLR plug's pin 3 not being connected to anything. (With a balanced connection, the pins 2 and 3 levels referred to ground are in antiphase and are each 6dB lower than when referred to each other.) I continued the testing by running a single-ended signal into the amplifier's XLR jack with a Cardas RCA–XLR adapter, using the adapter's pin 1 as ground and pin 2 as signal. The voltage gain into 8 ohms was now the correct 26dB, and the frequency response was full range.


As both my samples of the Infigo Method 3 behaved identically on the test bench, I had JVS's samples shipped to me. I performed a limited set of tests on one of his amplifiers, serial number 3022-0005, which performed identically to the first two samples: clipping at 100W into 4 ohms, with crossover distortion in its output, and with much higher distortion at 5kHz than at 1kHz. With this sample, in contrast to the first two samples, the level of supply-related spuriae fluctuated occasionally during testing. (Sample '0002 had a slightly higher level of random noise in its output than sample '0003, but neither noisefloor level changed with time.)
It appears that all four samples of Infigo's Method 3 amplifier had a manufacturing defect that disabled class-A operation. Hans Looman let me know in an email that he was able to reproduce my findings: "I am scrutinizing the bias circuit to find and fix what's causing it, most likely an optimization I have made that caused unforeseen side effects," he wrote, adding "I am still researching and measuring the possible cause, which is potentially linked to the difference in power measured as well." He will be sending Stereophile samples that have had the problems addressed in production. We will report on their performance in a subsequent issue.
JVS's report on the sound of the samples was positive, and the first two samples I measured had been used at shows, apparently without any issues, by a loudspeaker manufacturer. Is this surprising? Despite the observed crossover-distortion products, the distortion level is very low with a 1kHz signal, so it might have not set off alarm bells. While the THD at higher frequencies is much higher in level, the odd-order distortion harmonics will be at the top of or beyond the limit of human hearing sensitivity.
The shortfall in 4 ohm power might not be an issue with music, even with the demanding impedance of JVS's Wilson speakers, as I doubt he asked the amplifiers to deliver more than 50W or so. The clipping power into 4 ohms at high frequencies will be lower, but that would probably not be noticed with typical music spectra, which tend to be "pink" in nature. This would also be the case with intermodulation distortion.—John Atkinson
Fig.1 Infigo Method-3, frequency response at 2.83V into: simulated loudspeaker load (gray), 8 ohms (blue), 4 ohms (magenta), 2 ohms (red) (1dB/vertical div.).
Fig.2 Infigo Method-3, small-signal 10kHz squarewave into 8 ohms.
The Infigo preserved absolute polarity (ie, was noninverting). The input impedance was 9.89k ohms at 20Hz and 1kHz, 9.7k ohms at 20kHz. The Method 3's output impedance, including the series impedance of 6' of spaced-pair loudspeaker cable, was very low, at 0.09 ohm at 20Hz and 1kHz, increasing slightly to 0.12 ohm at 20kHz. The modulation of the amplifier's frequency response due to the Ohm's law interaction between this source impedance and the impedance of our standard simulated loudspeaker was small, at ±0.1dB (fig.1, gray trace). The response into an 8 ohm resistive load (fig.1, blue trace) was down by just 0.6dB at 100kHz, though the increasing output impedance at very high frequencies means that the ultrasonic rolloff into 4 ohms (magenta) and 2 ohms (red) was slightly greater. The Method 3's reproduction of a 10kHz squarewave into 8 ohms (fig.2) was superb, with no overshoot or ringing.
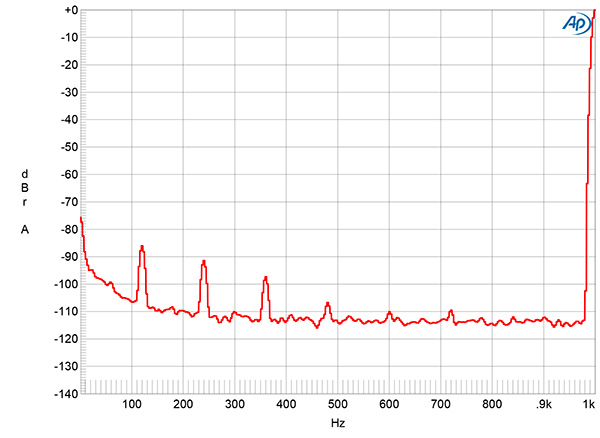
Fig.3 Infigo Method-3, spectrum of 1kHz sinewave, DC–1kHz, at 1W into 8 ohms (red) (linear frequency scale).
Measured with the single-ended input shorted to ground, the amplifier's unweighted, wideband signal/noise ratio was an excellent 85.3dB ref. 1W into 8 ohms. This ratio improved to 87dB when the measurement bandwidth was restricted to 22Hz–22kHz and to 98.5dB when A-weighted. While power-supply–related spuriae were present in the Method 3's noisefloor (fig.3), these are negligible at –87dB and below ref. 1W into 8 ohms.
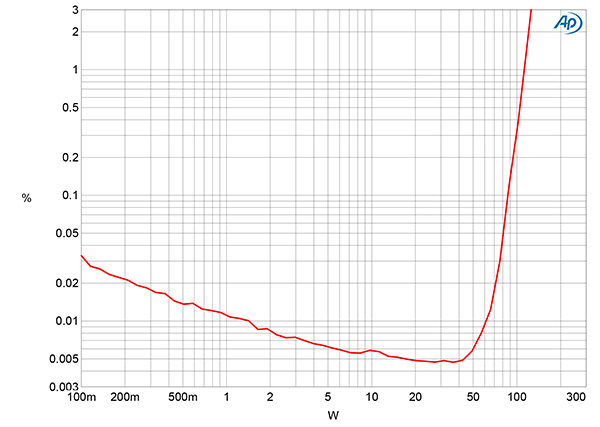
Fig.4 Infigo Method-3, distortion (%) vs 1kHz continuous output power into 8 ohms.
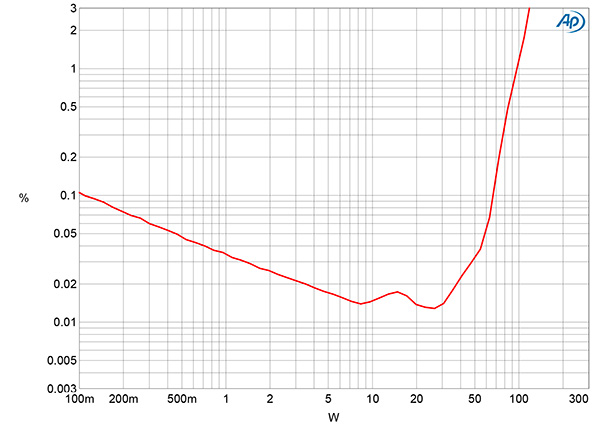
Fig.5 Infigo Method-3, distortion (%) vs 1kHz continuous output power into 4 ohms.
The Infigo Method 3 is specified as offering a maximum output power of 250W into 4 ohms (21dBW). Stereophile defines clipping as when the output's percentage of THD+noise reaches 1%; the Method 3 clipped with a 1kHz signal at 110W into 8 ohms (20.4dBW, fig.4) but at 100W into 4 ohms (17dBW, fig.5) rather than the specified 250W. The other Method 3 sample, '0002, clipped at the same powers into both impedances as sample '0003.
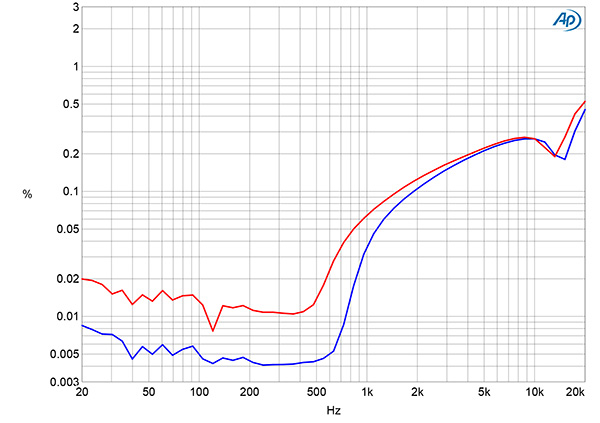
Fig.6 Infigo Method-3, THD+N (%) vs frequency at 12.67V into: 8 ohms (blue), 4 ohms (red).
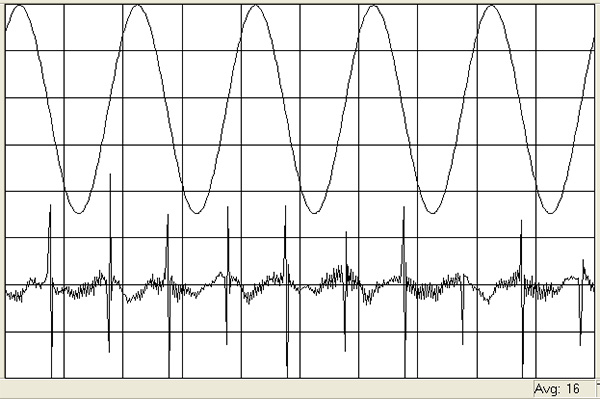
Fig.7 Infigo Method-3, 1kHz waveform at 20W into 8 ohms, 0.013% THD+N (top); distortion and noise waveform with fundamental notched out (bottom, not to scale).
I examined how the percentage of THD+N in the Infigo's output changed with frequency at 12.67V, which is equivalent to 20W into 8 ohms and 40W into 4 ohms (fig.6). The distortion was very low at low and midrange frequencies into both impedances but rose precipitously in the treble. When I examined the THD+N waveform with a 1kHz signal at 20W into 8 ohms, I saw crossover distortion (fig.7). I was surprised by this, as the Method 3's output stage is specified as operating in class-A, which eliminates crossover distortion in a push-pull circuit. I confirmed this finding with the magazine's APx555 analyzer; the crossover distortion was also present with sample '0002.
Fig.8 Infigo Method-3, spectrum of 1kHz sinewave, DC–10kHz, at 20W into 8 ohms (linear frequency scale).
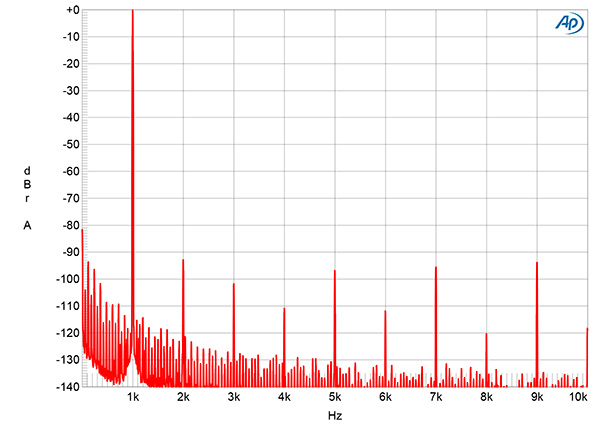
Fig.9 Infigo Method-3, spectrum of 5kHz sinewave, DC–40kHz, at 20W into 8 ohms (linear frequency scale).
Fig.10 Infigo Method-3, HF intermodulation spectrum, DC–30kHz, 19+20kHz at 20W peak into 8 ohms (linear frequency scale).
The levels of the distortion harmonics are very low with the 1kHz signal (fig.8) but, as predicted by fig.6, very much higher with a 5kHz signal at the same power into 8 ohms (fig.9). The third, fifth, and seventh harmonics are dominant in this graph, each close to –60dB (0.1%). Along with this increase in distortion at high frequencies came a plethora of high-order intermodulation products when the Method 3 drove an equal mix of 19 and 20kHz tones with a peak level of 20W into 8 ohms (fig.10). However, the second-order difference product at 1kHz was lower in level, at –80dB (0.01%).


