Sidebar 3: Measurements
I used DRA Labs' MLSSA system, a calibrated DPA 4006 microphone, and an Earthworks microphone preamplifier to measure the Genelec G Three's frequency response in the farfield. I used an Earthworks QTC-40 mike for the nearfield responses.
Genelec specifies the G Three's input impedance as 10k ohms. As this is an active loudspeaker, I calculated the input impedance by using spot frequency tones generated by my Audio Precision SYS2722 and examining how the nearfield sound pressure level dropped when I increased the source impedance to 600 ohms from 20 ohms (single-ended) and 40 ohms (balanced). The single-ended impedance was close to 3.6k ohms across the audioband; the balanced impedance, as expected, was twice that value. While the lowish unbalanced input impedance won't present drive difficulties with solid state sources, the bass might sound a touch lightweight with a tubed preamplifier.
With the unbalanced input fed white noise at a magnitude of 330mV, the B-weighted SPL at 1m was 85.7dB(B). Genelec specifies the maximum long-term SPL as 97dB at 1m. My sensitivity estimate implies that this would be achieved with an input signal of just below 1.2V. (The 10dB attenuator was switched off for this measurement.)
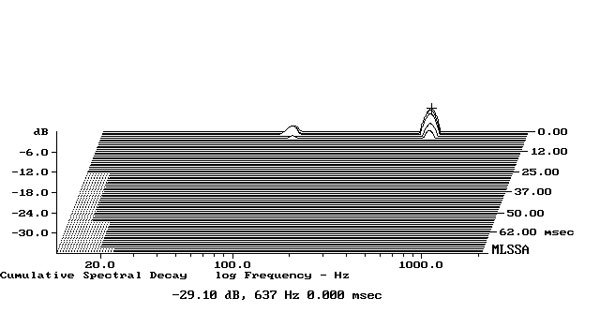
I investigated the enclosure's vibrational behavior with a plastic-tape accelerometer. It was extremely inert. The only resonant mode I found was on the sidewall, at 637Hz (fig.1), but this is vanishingly low in level, even at SPLs >90dB.
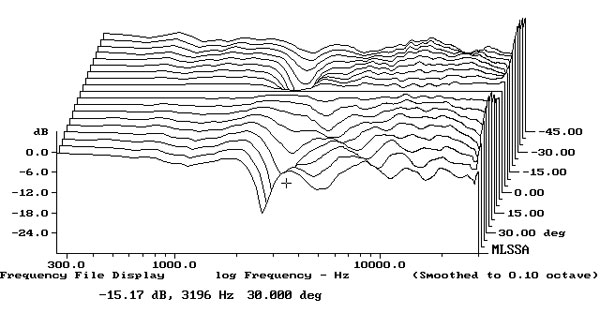
 The G Three's horizontal dispersion, normalized to the response on the tweeter axis, which thus appears as a straight line, is shown in fig.3. The contour lines in this graph are evenly spaced, with the radiation pattern smoothly narrowing in the treble. This is textbook behavior. Fig.4 shows the speaker's dispersion in the vertical plane. A suckout appears at 3.2kHz, the frequency of the crossover between the tweeter and woofer, 5° above and more than 10° below the HF axis. This graph confirms that, as shown in fig.2, the flattest treble response is obtained 3" below this axis.
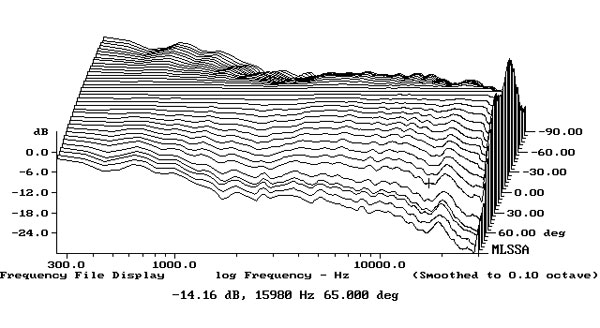
 In the time domain, the G Three's step response (fig.5) indicates that the tweeter's output arrives first at the microphone and is connected in negative acoustic polarity. The woofer is connected in positive polarity. The decay of the tweeter's step blends smoothly with the start of the woofers' step, implying optimal crossover implementation. The G Three's cumulative spectral-decay plot on the tweeter axis (fig.6) is superbly clean, the only significant ridge of delayed energy occurring at the tweeter's dome-resonance frequency. (As always in my CSD graphs, ignore the ridge just below 16kHz, which is due to interference from the test computer's video circuitry.)
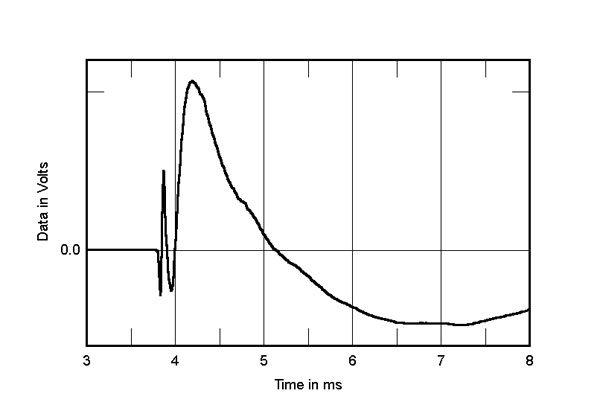
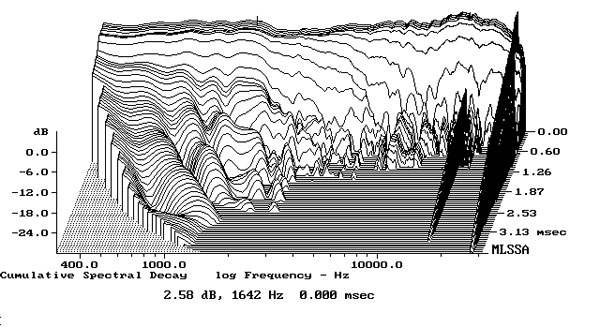
Fig.1 Genelec G Three, cumulative spectral-decay plot calculated from output of accelerometer fastened to center of sidewall (MLS driving voltage to speaker, 760mV; measurement bandwidth, 2kHz).
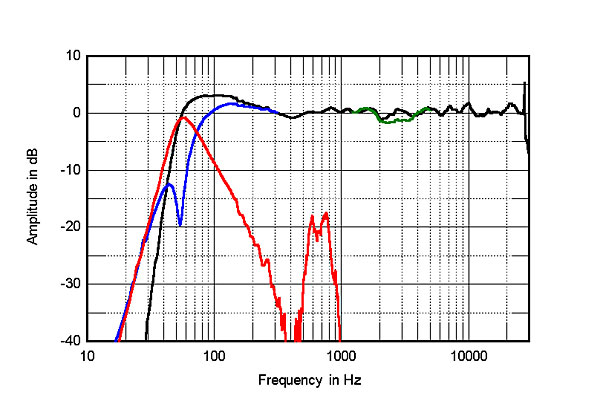
The blue trace in fig.2 shows the nearfield woofer output, the red trace that of the port on the speaker's rear. The notch at 54Hz in the woofer's output indicates that this is the port's tuning frequency. Both the woofer and port outputs roll off below that frequency with close to an 18dB/octave slope rather than the usual 12dB/octave slope. This implies the presence of a series capacitor in the woofer feed to limit low-frequency excursion. A couple of midrange peaks can be seen in the port's output, but these are well down in level.
Fig.2 Genelec G Three, anechoic response on HF axis at 50" (green) and the response 3" below that axis (black), both averaged across 30° horizontal window and corrected for microphone response, with the nearfield woofer (blue) and port (red) responses and their complex sum (black), respectively plotted below 300Hz, 950Hz, and 300Hz.
The rear-panel DIP switches were set to "Flat anechoic response" for these traces. Switching the bass to "–2dB," which is how the speakers had been set up by HR, reduced the levels of the woofer and port by 2dB. The "–4dB" setting reduced the levels by another 2dB, as did setting the bass to "–6dB." The "Tabletop" switch reduced the region between 150Hz and 300Hz by 2–4dB, while the "Low Bass –4dB" switch started the low-frequency rolloff slightly higher in frequency.
The black trace below 300Hz in fig.2 shows the complex sum of the woofer and port outputs, taking into account acoustic phase and the fact that the port is mounted on the G Three's rear panel. The low-frequency rolloff is steep, and the slight peak in the midbass region is due in part to the nearfield measurement technique, which assumes that the drive-units are mounted in a true infinite baffle, ie, one that extends to infinity in both planes. The farfield response on the tweeter axis, averaged across a 30° horizontal angle (fig.2, green trace), is extraordinarily even, though there is a slight lack of energy in the presence region. Repeating the averaged response 3" below the tweeter axis (black trace) gave a flatter output in this region, the Genelec's farfield output now meeting ±1.5dB limits from 300Hz to 20kHz. (The specified listening axis is midway between the two drivers.) The sharp ultrasonic spike at 27.6kHz is due to the metal-dome tweeter's fundamental dome resonance. These traces were taken with the "Treble –2dB" DIP switch set to Flat. Turning it on shelved down the G Three's output above 7kHz, reaching –2dB at 15kHz.
Fig.3 Genelec G Three, lateral response family at 50", normalized to response on HF axis, from back to front: differences in response 90–5° off axis, reference response, differences in response 5–90° off axis.
Fig.4 Genelec G Three, vertical response family at 50", normalized to response on HF axis, from back to front: differences in response 45–5° above axis, reference response, differences in response 5–45° below axis.
Fig.5 Genelec G Three, step response on HF axis at 50" (5ms time window, 30kHz bandwidth).
Fig.6 Genelec G Three, cumulative spectral-decay plot on HF axis at 50" (0.15ms risetime).
The Genelec G Three offers superb measured performance, and the versatility of its tone controls will allow that performance to be optimized for specific locations.—John Atkinson