I performed a full set of measurements on the Eversolo Play using my Audio Precision SYS2722 system. When I connected the amplifier's Ethernet port to my network, as is usually the case these days the Play updated its firmware to the latest version. Once the update to v1.5.30 was installed and the amplifier restarted, Roon recognized it as the Roon Ready "Eversolo Play." I then installed the Eversolo Control app on my iPad mini. I controlled the Play with both the front-panel touchscreen and the app. I also used the app to make sure that all the EQ settings were bypassed for the testing.
As the Play uses a class-D output stage that emits relatively high levels of ultrasonic noise that would drive my analyzer's input into slew-rate limiting, I inserted an Audio Precision AUX-0025 passive low-pass filter between the test load and the analyzer. This filter mitigates noise above 80kHz and eliminates noise above 200kHz. Without the filter, 501mV of ultrasonic noise with a center frequency of 453kHz was present in the amplifier's speaker outputs. I used this filter for all the power amplifier tests other than the frequency response. I preconditioned the amplifier by running it at a moderate power into 8 ohms for 30 minutes before starting the testing.
Looking first at the Play's single-ended line inputs, the amplifier inverted absolute polarity at the speaker outputs but preserved polarity at the single-ended subwoofer output. The line input impedance was a usefully high 90k ohms at 20Hz and 1kHz, dropping inconsequentially to 74k ohms at 20kHz. The volume control can be set to operate in accurate 0.5dB, 1dB, 2dB, or 3dB steps; with the volume control set to the maximum, "0dB," the voltage gain at 1kHz from the loudspeaker outputs into 8 ohms was close to the specified 20dB, at 20.9dB. With the subwoofer output's gain set to unity and the crossover frequency set to 500Hz—the crossover frequency can be set anywhere between 40Hz and 500Hz—the maximum gain at 100Hz was –0.64dB.
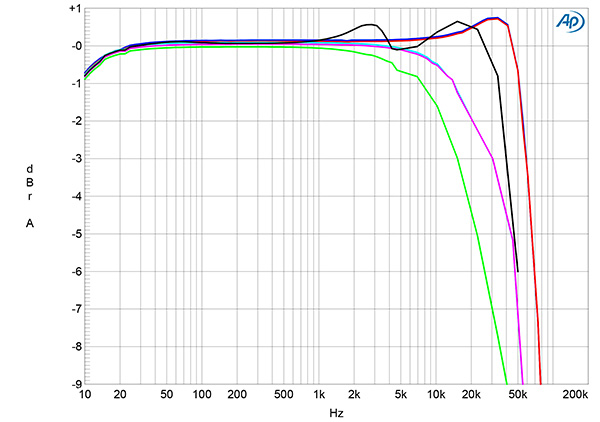
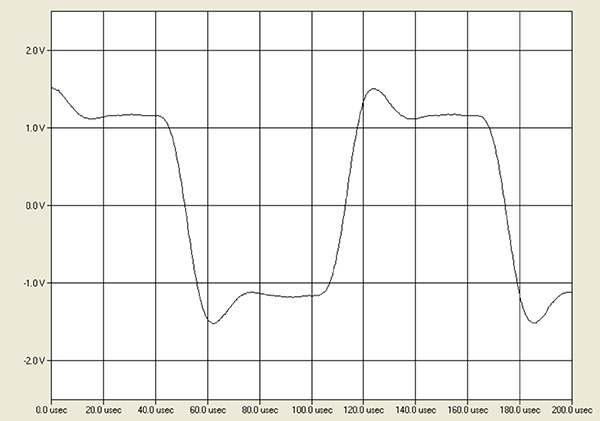
The subwoofer output impedance was very low, at 0.8 ohm. The loudspeaker output impedance was also extremely low in the bass and midrange, at 0.06 ohm, though it rose to 1 ohm at the top of the audioband. The modulation of the Play's frequency response due to the Ohm's law interaction between this impedance and the impedance of our standard simulated loudspeaker was negligible below 1kHz but reached ±0.3dB at higher frequencies (fig.1, gray trace). The amplifier's response into resistive loads was flat in the audioband but rose by 0.8dB at 32kHz into 8 ohms (blue and red traces); it was down by 3dB at 30kHz into 4 ohms (cyan, magenta traces) and by 3dB at 16kHz into 2 ohms (green trace). Both the very close channel balance and the overall response were preserved at lower settings of the volume control. The Play's reproduction of a 10kHz squarewave into 8 ohms (fig.2) had a critically damped overshoot on the waveform's leading edges, correlating with the boost in the amplifier's response in the top octaves seen in fig.1.
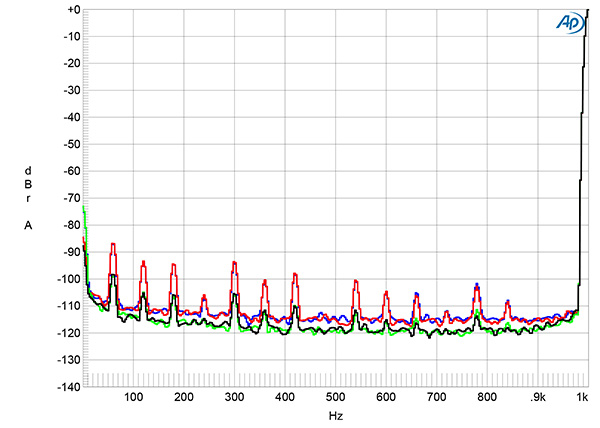
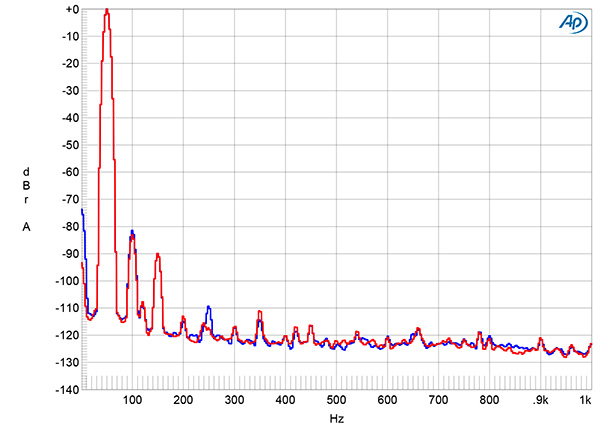
Channel separation was excellent, at >90dB below 2kHz and still 65dB L–R and 85dB R–L at 20kHz. The wideband, unweighted signal/noise ratio, taken with the unbalanced input shorted to ground, the volume control set to its maximum, and with the Audio Precision low-pass filter, was a good 70.25dB in both channels, ref. 2.83V, which is equivalent to 1W into 8 ohms. This ratio improved to 76.5dB when the measurement bandwidth was restricted to the audioband and to 79.7dB when A-weighted. The spectrum of the Play's low-frequency noisefloor at 1Wpc into 8 ohms with the volume control set to its maximum is shown by the blue and red traces in fig.3. The relatively low levels of both the supply-related spuriae and the random noise components dropped by up to 10dB when I set the volume control to –12dB and increased the level of the input signal so that the output was the same 1Wpc into 8 ohms (green, gray traces).
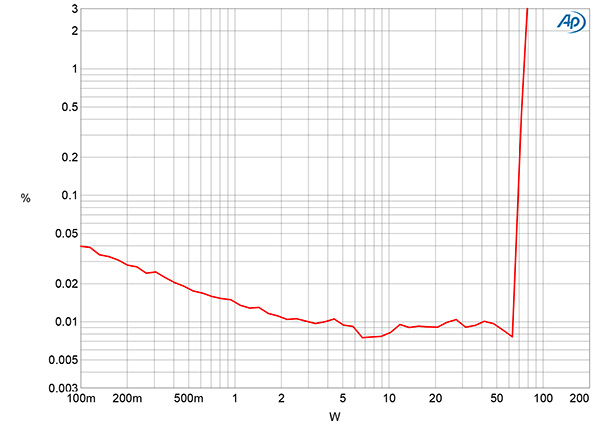
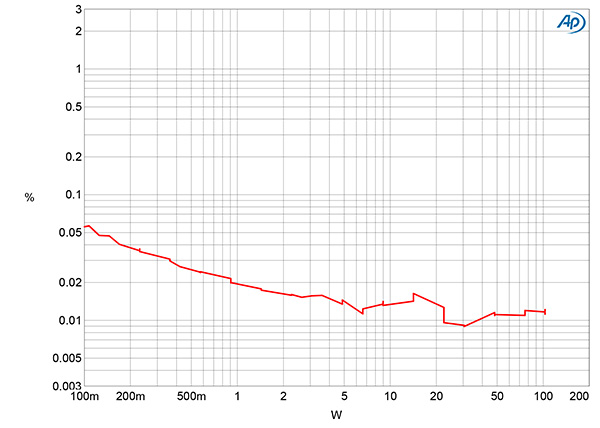
Fig.4 plots how the THD+noise percentage in the Eversolo's output varies with power into 8 ohms with both channels driven. At our usual definition of clipping, which is when the THD+N reaches 1%, the Play exceeded its specified output power of 60W into 8 ohms (17.8dBW) with a 1kHz signal, clipping at 74Wpc (18.7dBW). The maximum power into 4 ohms is specified as 110W (17.4dBW). However, the amplifier went into Standby mode at 105Wpc into 4 ohms (17.2dBW, fig.5). I turned the Play back on and continued with the testing. The FTC's updated "Amplifier Rule" states that maximum power should also be assessed at all frequencies in the audible range. I therefore repeated the clipping test with a 20kHz signal. The THD+N reached 1% at 81W into 8 ohms (19dBW) at this frequency, indicating that the Eversolo Play is fully compliant with the new FTC rule.
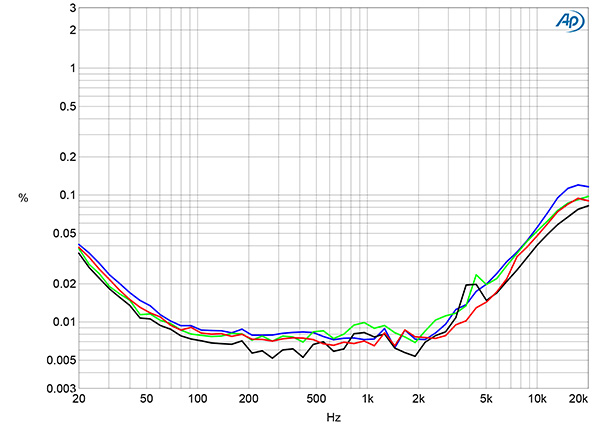
The downward slope of the trace in fig.4 indicates that actual distortion lies beneath the noisefloor below 10W. Fig.6 shows how the Play's THD+N percentage changed with frequency at 12.65V, which is equivalent to 20W into 8 ohms and 40W into 4 ohms. The distortion+noise into both loads is very low, though it rises in the top audio octaves and below 100Hz.
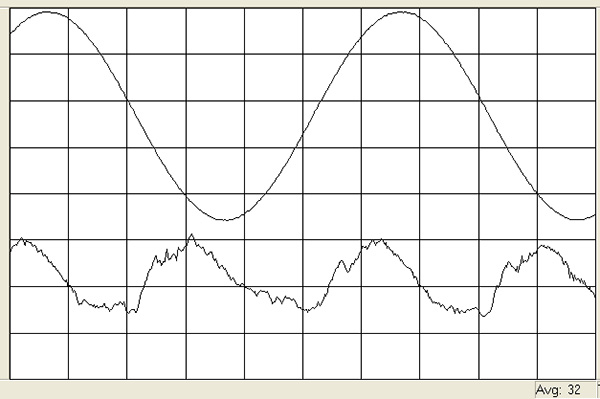
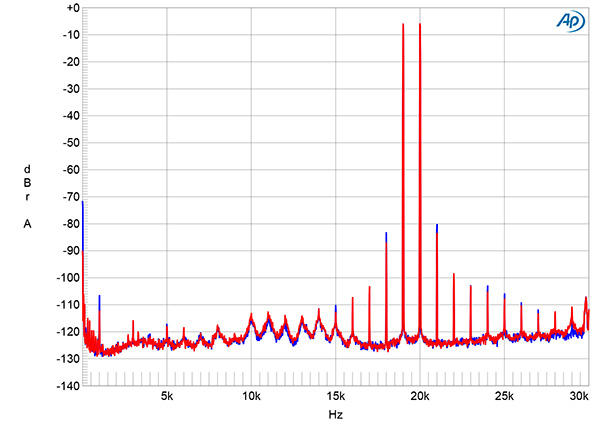
The THD+N waveform, taken at 20W into 8 ohms (fig.7), appears mostly to be the second harmonic, which was confirmed by spectral analysis (fig.8). The second harmonic lies at a very low –80dB (0.01%) even at 40W into 4 ohms, with the third harmonic 10dB lower in level. Intermodulation distortion with an equal mix of 19kHz and 20kHz tones was also very low in level (fig.9).—John Atkinson


