
The THD+noise results, plotted in fig.4, indicate moderately low readings across the audio band, with just slightly lower readings for the balanced configuration. In reality, these results are dominated by noise. This was verified by the difficulty I had in obtaining a readable distortion waveform at low output power. The THD+noise waveform shown in fig.5 was taken at a level of 50W into 4 ohms. It indicates a dominant third-order component, but also the presence of some higher-order harmonics plus noise. The same third-order dominance was found with 8 ohm and 2 ohm loads (not shown). 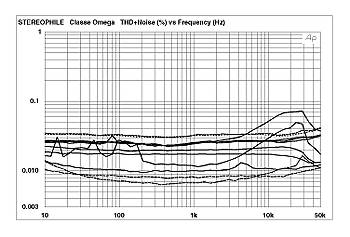 Fig.4 Classé Omega, THD+noise vs frequency at (from top to bottom at 10kHz): 4W into 2 ohms, 2W into 4 ohms, unbalanced, balanced; 1W into 8 ohms, unbalanced, balanced; and 2.83V into simulated loudspeaker load.
 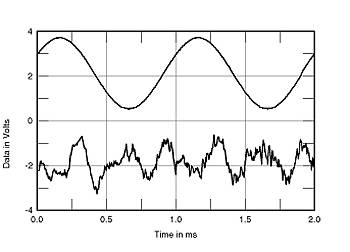 Fig.5 Classé Omega, 1kHz waveform at 50W into 4 ohms (top), distortion and noise waveform with fundamental notched out (bottom, not to scale).
Fig.6 shows the output spectrum of a 50Hz input at 300W into 8 ohms. All distortion artifacts are extremely low—well under -80dB (or about 0.01% THD+noise), with the third harmonic again the highest in level. Fig.7 shows a similar spectral plot, this one the result of a combined 19+20kHz signal. The distortion here indicates the sum and difference tones created by the amplifier with these frequencies at the input; or, in other words, the intermodulation between these two tones. It, too, is very low in level.
Fig.5 Classé Omega, 1kHz waveform at 50W into 4 ohms (top), distortion and noise waveform with fundamental notched out (bottom, not to scale).
Fig.6 shows the output spectrum of a 50Hz input at 300W into 8 ohms. All distortion artifacts are extremely low—well under -80dB (or about 0.01% THD+noise), with the third harmonic again the highest in level. Fig.7 shows a similar spectral plot, this one the result of a combined 19+20kHz signal. The distortion here indicates the sum and difference tones created by the amplifier with these frequencies at the input; or, in other words, the intermodulation between these two tones. It, too, is very low in level. 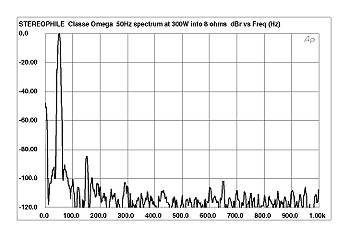 Fig.6 Classé Omega, spectrum of 50Hz sinewave, DC-1kHz, at 300W into 8 ohms (linear frequency scale).
 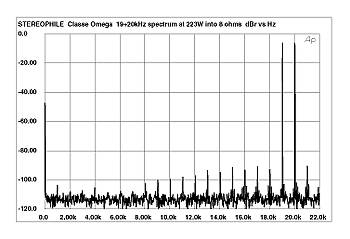 Fig.7 Classé Omega, HF intermodulation spectrum, DC-22kHz, 19+20kHz at 223W into 8 ohms (linear frequency scale).
Fig.4 Classé Omega, THD+noise vs frequency at (from top to bottom at 10kHz): 4W into 2 ohms, 2W into 4 ohms, unbalanced, balanced; 1W into 8 ohms, unbalanced, balanced; and 2.83V into simulated loudspeaker load. Fig.5 Classé Omega, 1kHz waveform at 50W into 4 ohms (top), distortion and noise waveform with fundamental notched out (bottom, not to scale). Fig.6 Classé Omega, spectrum of 50Hz sinewave, DC-1kHz, at 300W into 8 ohms (linear frequency scale). Fig.7 Classé Omega, HF intermodulation spectrum, DC-22kHz, 19+20kHz at 223W into 8 ohms (linear frequency scale).