I tested the Burmester 151 Musiccenter MK2 with my Audio Precision SYS2722 system, controlling it with the Burmester app on the included iPad mini. (After I connected the Musiccenter to my network, the iPad app communicated with it via Wi-Fi.) I used coaxial and optical S/PDIF data, test CDs, and WAV files on a USB stick inserted into one of the rear Type A USB ports. (The Burmester was set to recognize USB files automatically and switched the app to the appropriate Player page when I plugged in the USB stick.) The volume can be set to Variable, with a choice of four maximum levels, or to Fixed, with or without Volume Normalization. JVS used the latter setting for most of his auditioning, with 192kHz upsampling, so that is how I performed the majority of the tests.
The maximum output level in Variable mode set to Medium was 2.3V, balanced, and 1.15V, unbalanced, with a 1kHz signal at 0dBFS. The Low setting reduced this level by 10dB, High increased it by 3dB, and Very High by 6dB. The two highest settings resulted in waveform clipping when the volume control was set to its maximum. In the Burmester's fixed-output mode, the S/PDIF inputs can be set to a maximum output level ranging from –6dB to +6dB referenced to a nominal 0dB. I left them set to "0.0dB." In Fixed mode, the output level with S/PDIF data at 0dBFS was 4.167V, balanced, and 2.083V, unbalanced. The maximum output level with both CD playback and USB data was half these levels, which suggests that the output for these sources is fixed at –6dB. (I couldn't find an iPad app setting that allowed this to be changed with these sources.)
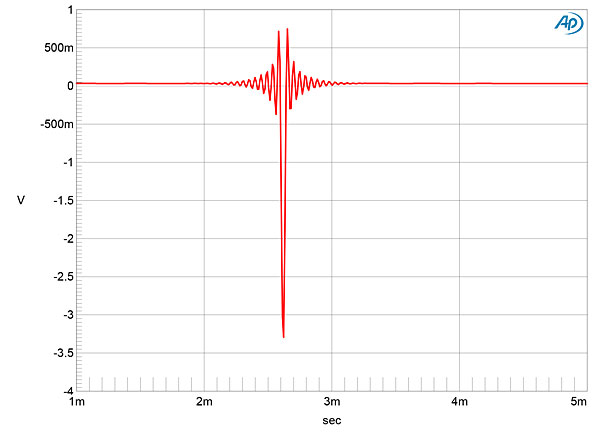
The 151 Musiccenter's balanced output impedance was a moderately low 514 ohms from 20Hz to 20kHz. The single-ended output impedance was half the balanced, as expected. The Burmester's impulse response, examined at the balanced outputs with 192kHz upsampling and the Phase set to "0 Degrees" (fig.1), indicates that it inverts absolute polarity. Repeating the measurement at the unbalanced output gave the correct, noninverted polarity. The XLR output jacks must therefore be wired with pin 3 positive, the opposite of the AES standard. The Musiccenter's impulse response with 96kHz upsampling and with CD data was identical. The digital reconstruction filter is a conventional linear-phase type, with equal amounts of ringing before and after the single sample at 0dBFS.
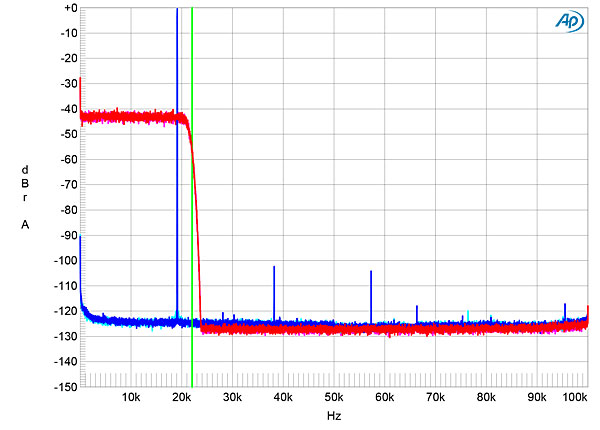
With 44.1kHz white noise at –4dBFS and 192kHz upsampling (fig.2, red and magenta traces), the 151 MK2 Musiccenter's response was flat up to 20kHz then rolled off sharply, reaching full stop-band suppression at 24kHz, just above the Nyquist frequency of 22.05kHz (green vertical line). The distortion harmonics associated with a full-scale tone at 19.1kHz (blue and cyan traces) were very low in level, and the aliased image at 25kHz of this tone is absent. The spectrum was identical with 96kHz upsampling and with all digital sources.
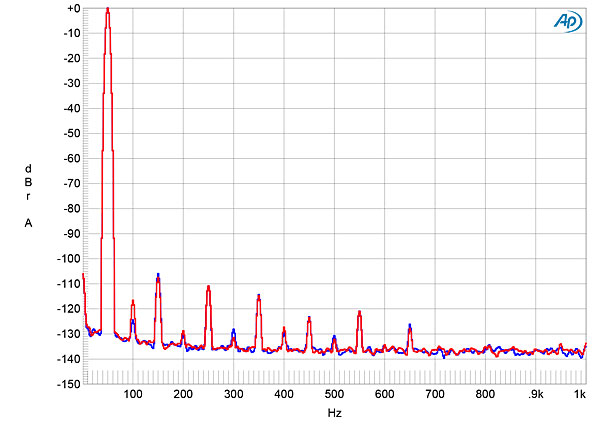
The 151 Musiccenter's frequency response with 192kHz sampling followed the same basic shape at sample rates ranging from 44.1kHz (fig.3, green and gray traces) to 192kHz (blue and red traces), with a sharp rolloff just below the Nyquist frequency at sample rates lower than 192kHz. The response with 192kHz data but 96kHz upsampling (fig.4) followed the same shape up to 47kHz as the cyan and magenta traces in fig.3, which were taken with 96kHz data, but was corrupted by aliased images above that frequency. This won't have audible consequences, but for best technical performance, leave the Musiccenter set to 192kHz upsampling. Channel separation (not shown) was superb, at >120dB in both directions below 2kHz and still 110dB at 20kHz. The low-frequency noisefloor, examined with a 1kHz tone at 0dBFS, was clean (fig.5), with no power supply–related spuriae present.
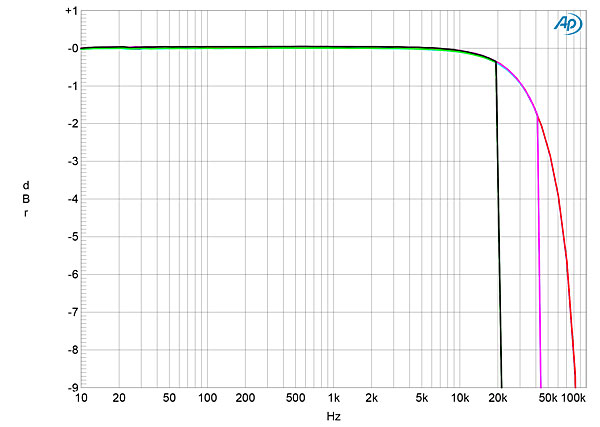
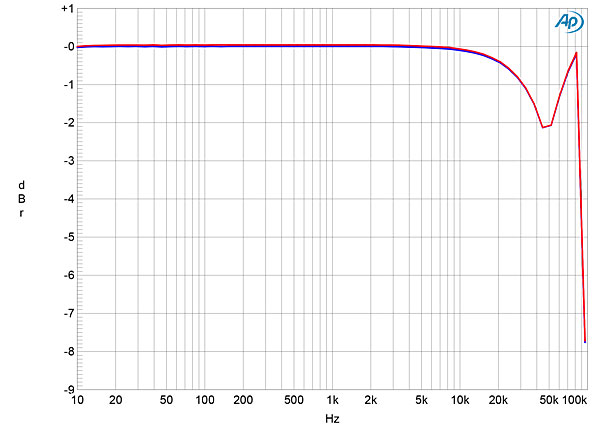
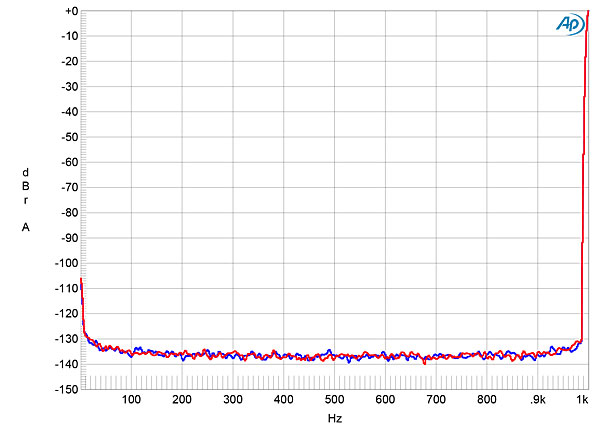
Fig.6 shows the 151 Musiccenter MK2's output spectrum with a dithered 1kHz tone at –90dBFS with 16-bit data (cyan and magenta traces) and 24-bit data (blue and red traces). With the 16-bit data, the noisefloor is that of the dither used to encode the signal. With 24-bit data, the random noisefloor drops by 20dB, which suggests a resolution of slightly more than 19 bits.
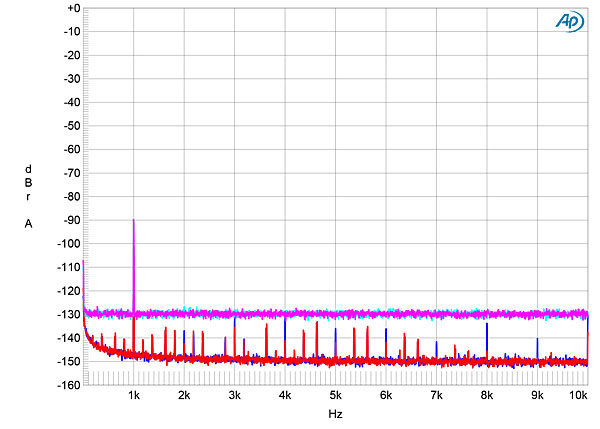
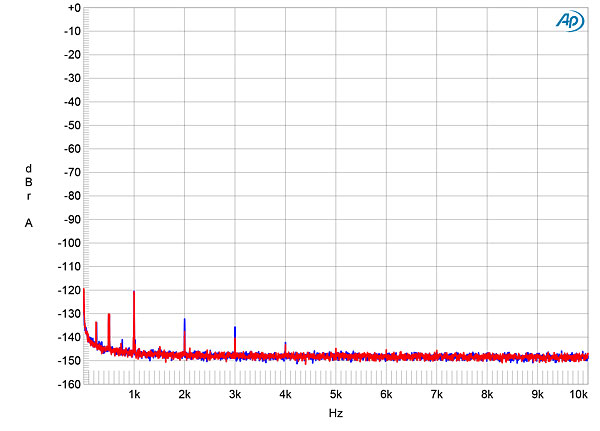
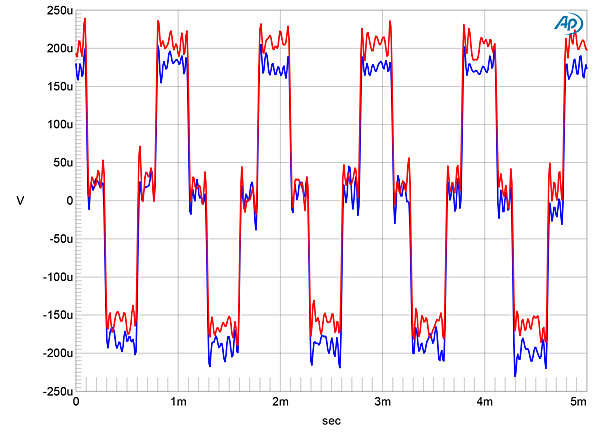
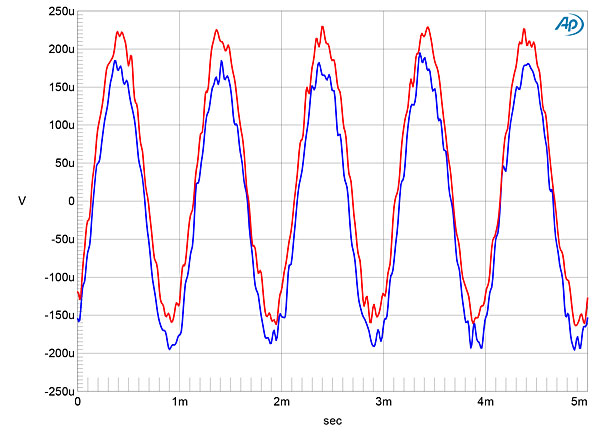
A regular series of very low-level spurious tones is present. This graph was taken with 192kHz upsampling; there was no change with 96kHz upsampling. With a dithered 24-bit tone at –120dBFS (fig.7), the spectrum was clean other than some low-order harmonics at or below –130dB. With undithered 16-bit data representing a tone at exactly –90.31dBFS (fig.8), the three DC voltage levels described by the data were well resolved, and the waveform was perfectly symmetrical. With undithered 24-bit data, the Burmester reproduced a relatively clean sinewave (fig.9).
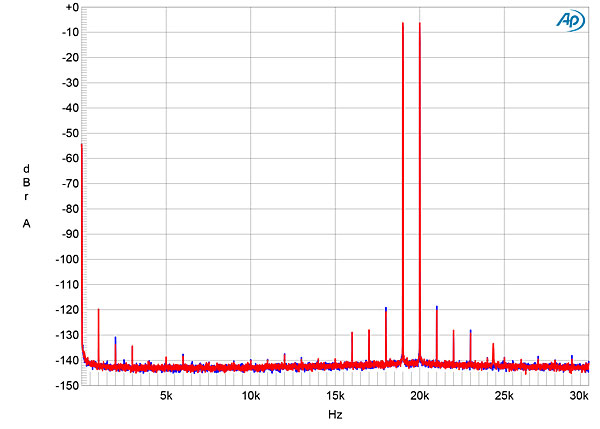
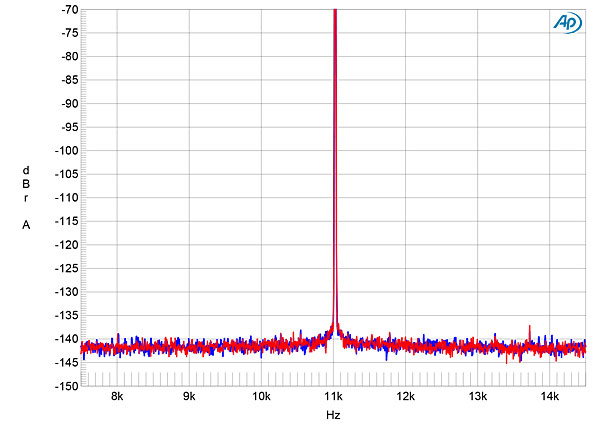
The Burmester featured very low levels of harmonic distortion, with the third harmonic the highest in level at –106dB (0.0005%) with 24-bit data (fig.10). Commendably, the level of this harmonic didn't increase when I reduced the load to 600 ohms. The spectrum of the 151 Musiccenter's output while it reproduced a mix of equal levels of 19 and 20kHz tones, the signal peaking at 0dBFS, is shown in fig.11. All the intermodulation products lie at or below –120dBFS (0.0001%). As expected from fig.2, no aliased images of the tones are present. This spectrum was taken with 192kHz upsampling into 100k ohms. It didn't change with 96kHz upsampling or into 600 ohms.
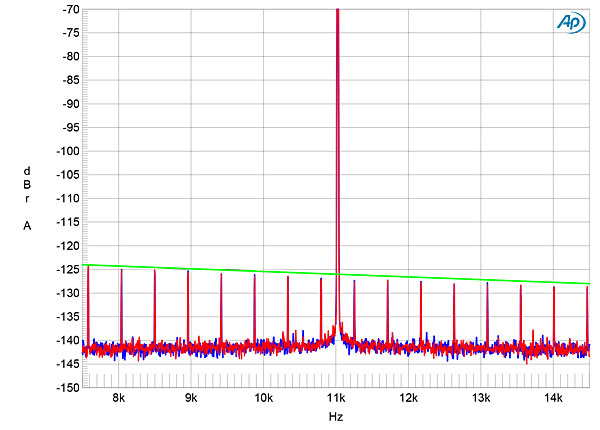
I tested the 151 Musiccenter's rejection of word-clock jitter with the undithered Miller-Dunn J-Test signal sourced via S/PDIF with a 15' plastic optical cable, which will be the worst case. The Burmester reproduced the odd-order harmonics of the LSB-level, low-frequency squarewave very close to the correct levels (fig.12 sloping green line), and no other sidebands were present. With 24-bit J-Test data (fig.13), the spectrum was clean.
As the Musiccenter can be used to play CDs, I used the Pierre Verany Digital Test CD, which has gaps of various lengths in the data spiral, to check its error correction. The Compact Disc Standard requires only that a player cope with gaps of up to 0.2mm in length, but the 151 Musiccenter played all the tracks without audible glitches, though it did hesitate briefly before playing the track with a 4mm gap in the data. This superb error correction/concealment is appropriate for a transport that can be used to rip CDs.
Although JVS didn't audition the 151 MK2 Musiccenter's balanced analog inputs, I performed a basic set of measurements using those inputs. The input impedance was 9.2k ohms and, as with the digital inputs, the balanced outputs inverted the absolute polarity of analog input signals. The single-ended outputs were noninverting. In fixed-output mode, the gain was unity at the balanced outputs—ie, an input of 1V resulted in an output of 1V—and 500mV, –6dB, at the unbalanced outputs. In Variable mode, the maximum gain was unity (0dB) set to Medium, –10dB set to Low, +3dB set to High, and +5.8dB set to Very High.
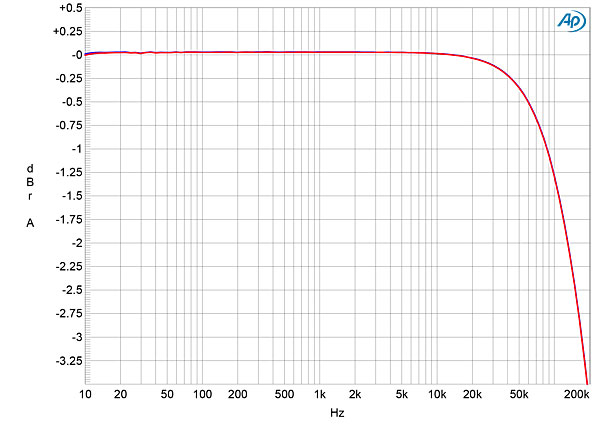
The analog inputs offered a wide frequency response, with the output down by 3dB at 180kHz (fig.14). Channel separation via the analog inputs was even higher than it had been for the digital inputs, at >130dB below 10kHz, and distortion was very low, reaching 0.0002% at 2V output. Set to unity gain and driven by an analog input signal, the balanced analog outputs clipped at 10V into 100k ohms, well above what will be required in real-world use.
I was initially concerned by the non-integer upsampling of 44.1kHz data—integer sample-rate conversion is preferable, as this means that every second or fourth sample in the upsampled data is the same as the original data. However, the Burmester 151 MK2 Musiccenter's performance on the test bench indicates excellent audio engineering in both the digital and analog domains. It gets a clean bill of health from this measurer.—John Atkinson