I performed a full set of measurements on two samples of the Benchmark AHB2 (serial nos. 14440108-0 and 14440111-0), using my Audio Precision SYS2722 system (see the January 2008 "As We See It"), and the amplifier's binding posts rather than its Neutrik terminals. As the AHB2 is specified as having a maximum power output of 100Wpc into 8 ohms, I preconditioned it before measuring it by running it at one-third that power into 8 ohms for an hour. Following that period, the top panel was warm, at 106.7°F (41.5°C), though the heatsinks were hotter, of course, at 117.3°F (47.4°C). The percentage of THD+noise at this power level was an extremely low 0.0005% with the AHB2 fully warm.
I had first learned about the power-supply and amplifier topology used in the AHB2 at the 2012 Consumer Electronics Show. Laurie Fincham of THX had explained to me that the innovative technology, developed by a team including Fincham, Andrew Mason, and Owen Jones (twin brother of noted speaker designer Andrew Jones), offered both extremely efficient conversion of AC power from the wall into DC power to feed to the amplifier circuit and extraordinarily low distortion. (An interview Scott Wilkinson conducted with Fincham about this technology can be seen at Scott's website, Home Theater Geeks.") In a presentation at the 2013 Rocky Mountain Audio Fest, Fincham and Benchmark's John Siau explained how the AHB2 used the THX technology to produce a 100W amplifier with sufficient dynamic range—ie, very low noise and distortion compared with the maximum signal voltage—to preserve the theoretical dynamic range of high-resolution recordings.
Each 1-bit increase in bit depth is equivalent to lowering the noise floor by 6.02dB. The 16-bit Compact Disc therefore has a noise floor at –96dB and change, hence cannot resolve information lower than –96dB. (This is without noiseshaping and dither.) By analogy, an amplifier with a maximum signal/noise ratio of 96dB would, if its noise floor were random, have 16-bit resolution. The Benchmark amplifier has a claimed S/N ratio "approaching 130dB," which, at 6.02dB per bit, is equivalent to more than 21-bit resolution. This is superb performance, given that the practical limit of DAC resolution is currently also close to 21 bits. Conventionally, it is assumed that the measurement system used to test a product is much better than the device under test.
However, the Benchmark amplifier's specifications are close to those of my Audio Precision system, both regarding the purity of its signal generator and the dynamic range of its analyzer. Correctly characterizing the AHB2's measured performance would therefore present a challenge. And, to my embarrassment, one of the speaker cables with which I routinely measure amplifiers and my test load set to 4 ohms were also introducing small amounts of nonlinearity. These problems—and here I'm talking about the difference between 0.0003% THD+noise and 0.0005%—haven't affected the measured performance of other amplifiers I've tested, but they were detectable with the AHB2's very low intrinsic distortion and noise. For this review, THX's Andrew Mason supplied me with a custom test load made with resistors using nonferrous leads and terminals, and a speaker cable terminated with a Speakon connector, both of which had guaranteed negligible nonlinearity.
All measurements were taken with balanced input signals, and throughout this review I refer to the AHB2's Channel 1 as "left" and Channel 2 as "right." The voltage gain at 1kHz into 8 ohms depended on the rear-panel switch position. With the switch set to a sensitivity of "9.8V/22dBU," the gain was 9.2dB, which is appropriate for pro-audio sources but very low for domestic use. With the switch set to "4V/14.2dBU," the AHB2's gain was 17dB; with it set to "2V/8.2dBU," the gain was 22.9dB. This is still around 4dB lower than is usual for a domestic amplifier, but shouldn't be a problem with typical high-end preamplifiers and digital processors. The AHB2 preserved absolute polarity (ie, was non-inverting) at all three sensitivity settings, the XLR input jacks being wired with pin 2 hot. With the amplifier used in bridged-mono mode, the gain in the "2V/8.2dBU" condition was the expected 6dB higher than in stereo mode, at 29dB, an input signal of 100mV resulting in an output power of 1W into 8 ohms.
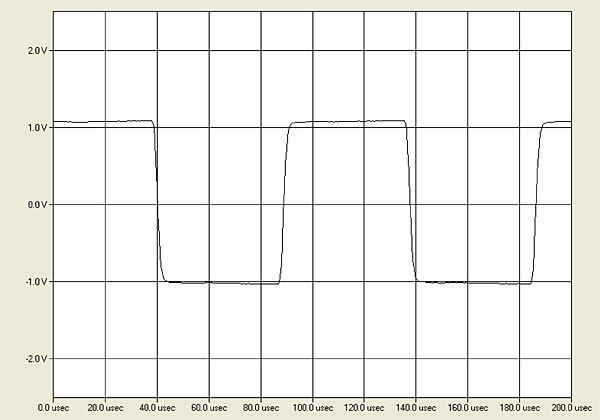
At 48k ohms, the input impedance was close to the specified 50k ohms at low and middle frequencies, but dropped to 31k ohms at the top of the audio band. This will have no practical consequences. The output impedance, including a 6' speaker cable, was a low 0.09 ohm at 20Hz and 1kHz, rising slightly to 0.22 ohm at 20kHz. As a result, the modification of the Benchmark amplifier's frequency response due to the interaction between this impedance and that of our standard simulated loudspeaker was just ±0.1dB (fig.1, gray trace). The amplifier offers a flat audioband response into 8 ohms, with then a –3dB point close to a high 200kHz (fig.1, blue and red traces), which correlates with the superbly square waveform of a 10kHz squarewave into this load (fig.2), with short risetimes and no overshoot or ringing. However, the AHB2's top-octave output starts to slope down slightly into lower impedances, with the response into 2 ohms down by 0.5dB at 20kHz and by 3dB at 91kHz (fig.1, green trace).
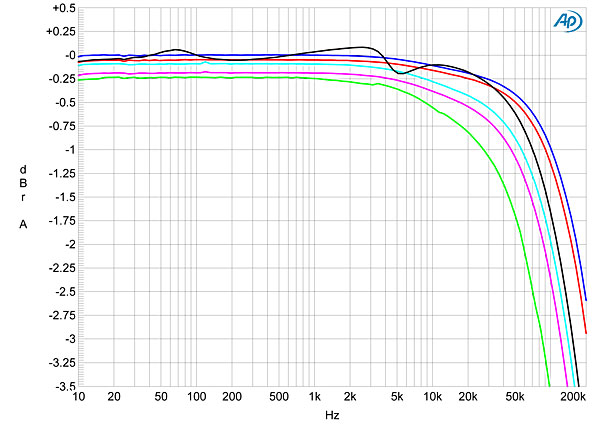
Commendably, the frequency response was not affected by the setting of the sensitivity switch, or by using the amplifier in bridged-mono mode. However, the ultrasonic response in bridged-mono mode shelved down faster than in stereo mode, and as the two channels' output stages are in series in this mode, the output impedance, again including the 6' of speaker cable, was higher than in stereo, at 0.14 ohm at 1kHz.
The AHB2's channel separation was superb at >110dB in both directions below 2kHz, and still 90dB at 20kHz. The wideband S/N ratio, measured in the high-gain, stereo condition with the input shorted to ground and ref. 1W into 8 ohms, was very high, at 89.3dB. Reducing the measurement bandwidth to 22Hz–22kHz increased the ratio to 106dB, while switching an A-weighting filter into circuit increased it further, to 108.5dB. Referenced to the AHB2's clipping power of 100W, this is equivalent to a dynamic range of 128.5dB, which is close to the specified 132dB. The S/N ratio did increase by around 3dB in the lowest-gain condition, implying that the specified ratio was measured in that mode. However, I was surprised to find that the S/N decreased slightly when the amplifier was very hot.
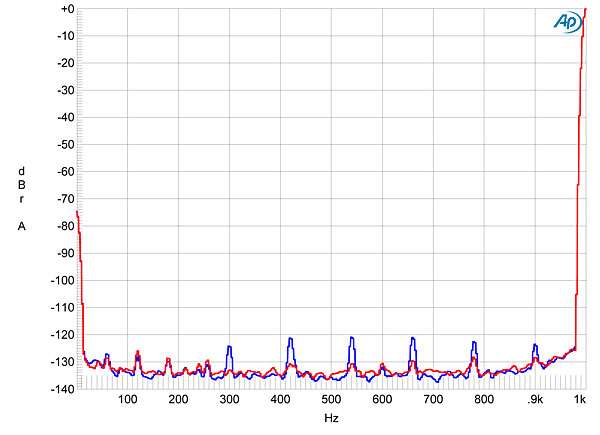
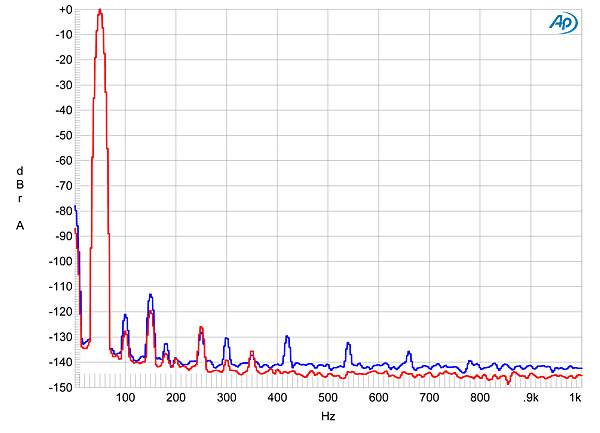
Fig.3 shows the spectrum of the AHB2's low-frequency noise floor while it drove 1kHz at 1W into 8 ohms. The level of random noise is very low—equivalent to 16 bits' worth of resolution, the RMS sum of the FFT bins adding up to –96dB (see above)—though some very low-level, power-supply–related spuriae can be seen, particularly in the left channel (blue trace). This graph was taken with each channel driven individually, the other not being connected. Peculiarly, when I repeated the spectral analysis with both channels driven simultaneously, the level of random noise in the right channel rose by 4–5dB.
We define clipping as being when the THD+noise percentage in an amplifier's output reaches 1%. However, performing this measurement proved problematic, as the AHB2's actual THD+noise percentage below the clipping point was only 2–3dB higher than the intrinsic distortion of my Audio Precision system. Andrew Mason therefore supplied me with a custom test procedure written by Audio Precision's Steve Petersen, which actually calculates the ratio between the sum of the distortion harmonics (thus disregarding the contribution of noise) for a series of output powers up to clipping.
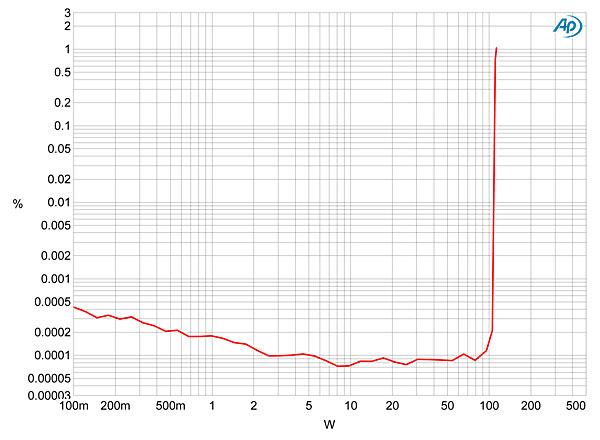
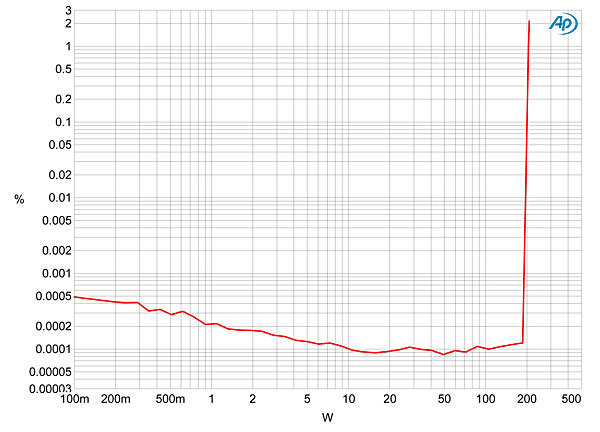
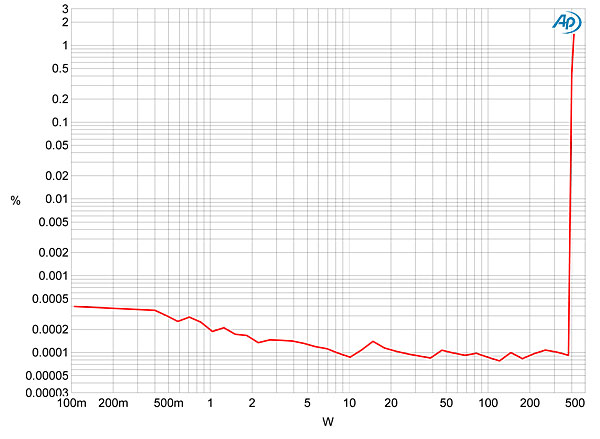
Using this procedure, and with just the left channel driven, the AHB2 clipped at 108W into 8 ohms (20.3dBW) and 210W into 4 ohms (20.2dBW), both powers slighter greater than those specified by Benchmark, which are with both channels driven. Fig.4 plots how the harmonic percentage changes with power into 8 ohms, fig.5 into 4 ohms. The traces in these graphs are very close to the measured residual level of the Audio Precision system, almost up to the point of actual clipping, which is extraordinarily linear for a power amplifier. Fig.6 plots the harmonic percentage with the amplifier in bridged-mono mode into 8 ohms. The clipping point is now 410W (26.1dBW), this also a little higher than Benchmark's specification.
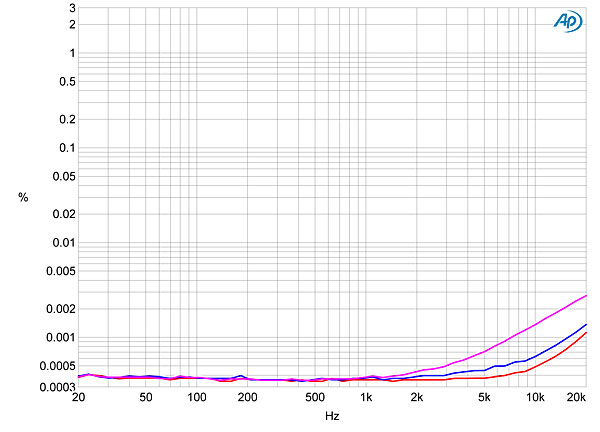
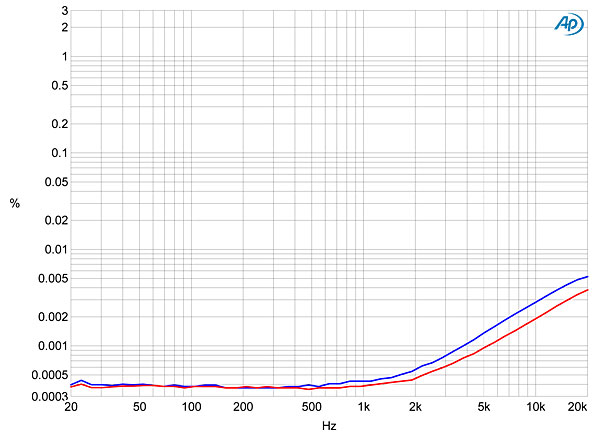
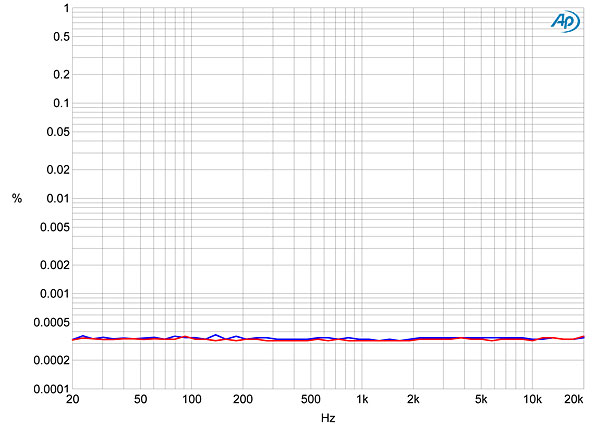
I plotted how the AHB2's THD+N changed with frequency at a level where I could be sure I was measuring actual THD rather than N: 15.5V, equivalent to 30W into 8 ohms, 60W into 4 ohms, and 120W into 2 ohms. Both channels were again extraordinarily linear into 8 ohms (fig.7, blue and red traces) and 4 ohms (magenta trace). The measured THD+N percentage did rise very slightly above 5kHz into 8 ohms, and there was a slightly greater rise into 4 ohms (fig.7, magenta) and 2 ohms (fig.8).
It was difficult to capture a representative distortion waveform into 8 ohms because the actual distortion was so low in level that it was obscured by noise, even at fairly high powers. But the oscilloscope trace (not shown) did suggest that the distortion is predominantly third-harmonic in nature. The blue trace in fig.9, taken at 50Wpc into 8 ohms, confirms that the third harmonic is highest, though the red trace—taken with the SYS2722's analyzer input looped back to its generator output at the same 20V level, so that any nonlinearity due to the analyzer's input circuitry would be the same in both channels—reveals that the Benchmark amplifier is adding only small amounts of the second and third harmonics at this output level.
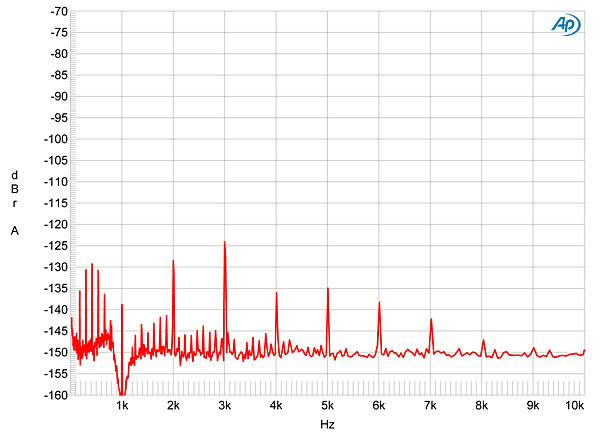
As a check, I performed a spectral analysis on the signal with the fundamental tone notched out, so that the full resolution of the Audio Precision's analyzer could be brought to bear on the distortion and noise with the AHB2 driving a 1kHz tone at 50Wpc into 8 ohms. To make the distortion harmonics stand out as much as possible from the level of random noise, I averaged 32 captures (footnote 1) to produce the graph shown in fig.10. (Note the expanded vertical scale in this graph.) The second and third harmonics lie at –128dB (0.00004%) and –124dB (0.00006%) with respect to what would have been the level of the fundamental; both are close to the residual distortion in the Audio Precision's signal generator (fig.11).
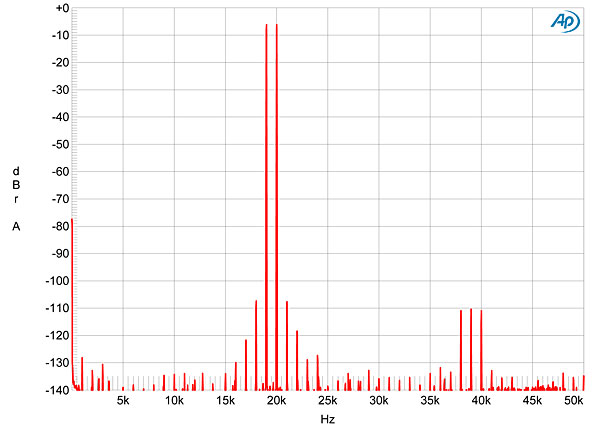
Finally, tested with an equal mix of 19 and 20kHz tones, the AHB2 produced very low levels of intermodulation distortion (fig.12).
Benchmark Media Systems' AHB2 is an extraordinary amplifier. Not only does its performance lie at the limits of what is possible for me to reliably test, it packs high power into a very small package, especially when used in bridged-mono mode. It is truly a high-resolution amplifier.—John Atkinson
Footnote 1: Because the distortion harmonics are correlated with the signal but the noise is not, each doubling of the number of captures will reduce the level of random noise by 3dB.—John Atkinson


