I performed a complete set of measurements on the WiiM Amp with my Audio Precision SYS2722 system. Before I did so, I installed the WiiM Home app on my iPad mini and connected the amplifier to my network with a CAT-5 Ethernet cable. The app (version 2.9.5.24041612) recognized the Amp, and I performed a factory reset.
Because the amplifier has a class-D output stage, I inserted an Audio Precision AUX-0025 passive low-pass filter between the test load and the analyzer. This filter mitigates noise above 80kHz and eliminates noise above 200kHz that would otherwise drive the SYS2722's input circuitry into slew-rate limiting. Without the filter, 470mV of ultrasonic noise with a center frequency of 460kHz was present at the amplifier's output terminals. I used the Audio Precision filter for all the tests other than frequency response. Because it operates in class-D, it wasn't necessary to precondition the WiiM Amp. Nevertheless, I left it powered up for 30 minutes before I started testing. The amplifier does get warm; after a couple of hours, the temperature of the top panel was 101.1°F (38.4°C).
Looking first at the WiiM Amp's behavior with its single-ended line input, the amplifier preserved absolute polarity. WiiM doesn't specify the Amp's input impedance; I measured 6250 ohms at 20Hz and 1kHz and 6050 ohms at 20kHz. The voltage gain at 1kHz into 8 ohms was lower than usual for an integrated amplifier, at 20.5dB. The gain from the mono subwoofer output was –6dB at 100Hz with the crossover set to the same frequency with the app, sourced from a low 55 ohms.
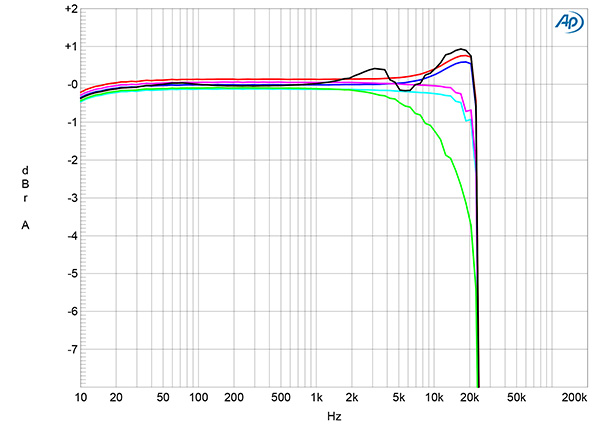
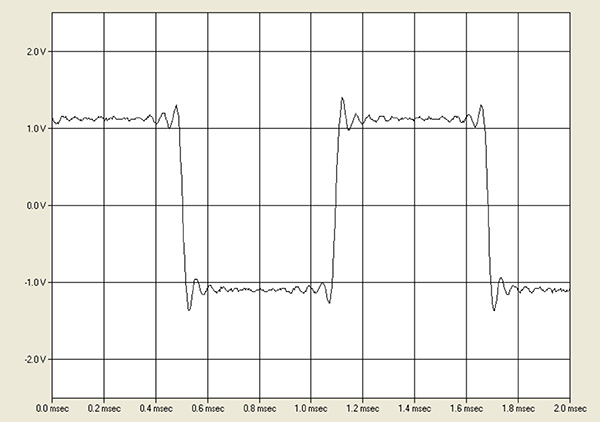
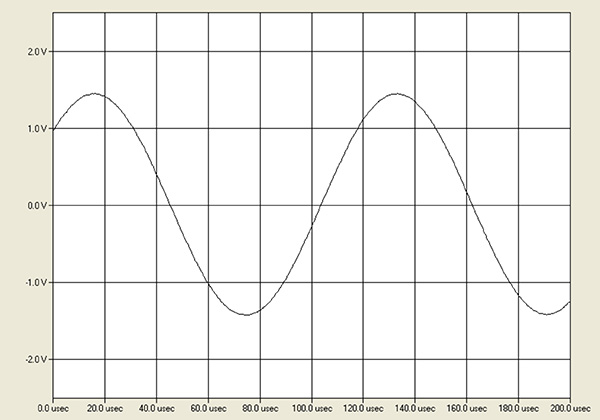
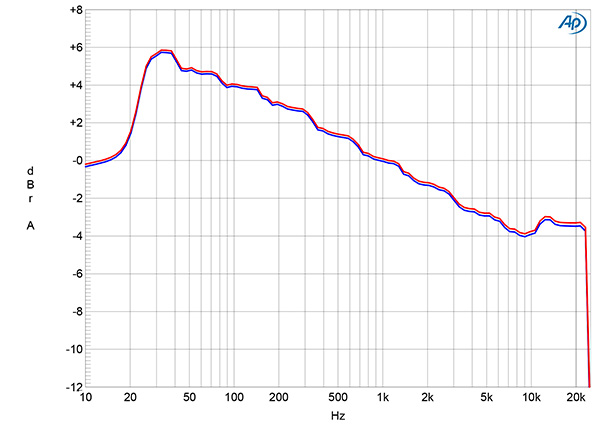
The loudspeaker output impedance, including the series impedance of 6' of spaced-pair cable, was a relatively low 0.1 ohms at 20Hz and 1kHz, rising to 1.1 ohms at 20kHz. As a result, the variation in the frequency response with our standard simulated loudspeaker (fig.1, gray trace) was minimal in the bass and midrange but reached ±0.3dB in the mid-treble region. The response into 8 ohms (blue and red traces) and 4 ohms (cyan, magenta) rose by almost 1dB in the top audio octave but was down by 1dB into 2 ohms (green trace). The output into all loads dropped precipitously above 22kHz, which indicates that the line input is digitized at a sample rate of 48kHz. The Amp's reproduction of a 1kHz squarewave into 8 ohms (fig.2) featured overshoot and ringing due to the A/D converter's antialiasing filter. A 10kHz squarewave was reproduced as a pure sinewave (fig.3), due to the third and higher-order harmonics being eliminated by the converter.
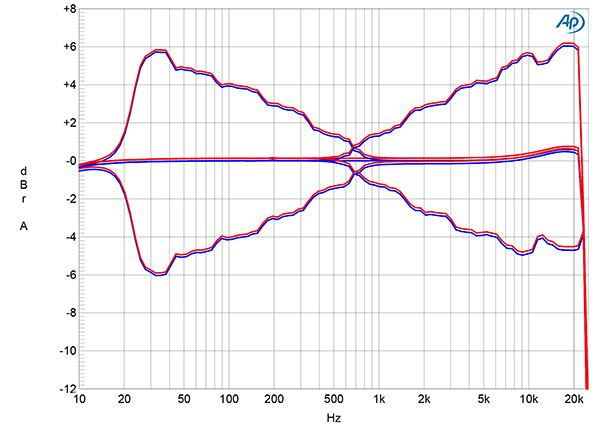
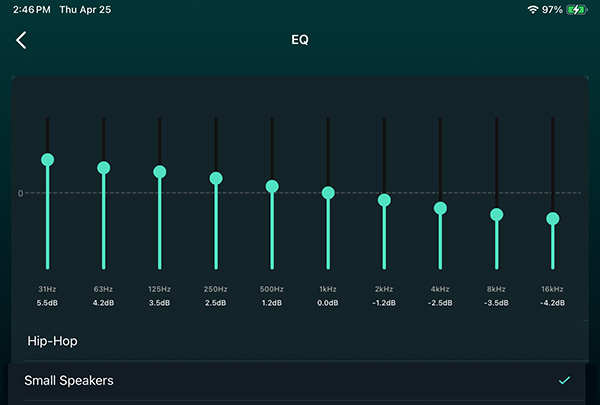
The WiiM Home app features a 10-band digital graphic equalizer, with several preset EQ settings. Five of the basic settings are shown in fig.4: Flat, Bass Booster, Bass Reducer, Treble Booster, and Treble Reducer. The boost and cut reach ±6dB compared with Flat. Other EQ presets have more exotic names, like Game, Hip-Hop, Dance, Movie, and Lounge. Fig.5 shows the effect of one that intrigued me, the Small Speakers setting. The response tilts down by 10dB between 30Hz and 9kHz.
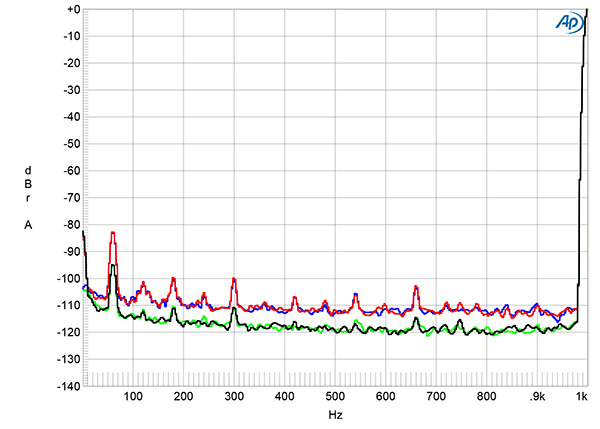
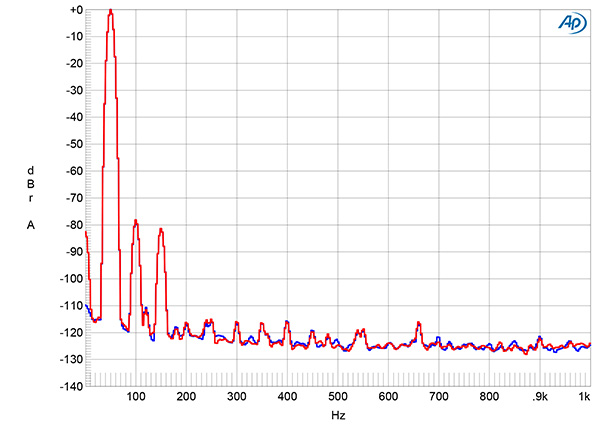
Channel separation, examined with the AUX-0025 passive low-pass filter, was 67dB across the audioband. (Looking at an oscilloscope screen while I performed this test, I could see that the crosstalk was due to signal leakage, not noise.) The unweighted, wideband signal/noise ratio, taken with the Audio Precision filter, the single-ended input shorted to ground, and the volume control set to the maximum, was a good 70dB ref. 1W into 8 ohms. This ratio improved to an excellent 86dB when the measurement bandwidth was restricted to 22Hz–22kHz, and to 90dB when A-weighted. Spectral analysis of the low-frequency noisefloor while the WiiM drove a 1kHz tone at 1Wpc into 8 ohms (fig.6) revealed low levels of both random noise and power-supply–related spuriae. The blue and red traces in this graph were taken with the volume control set to the maximum; reducing the volume by 12dB and increasing the input signal by the same 12dB, so that the output was still 1W into 8 ohms, dropped the noisefloor by up to 8dB (green and gray traces)
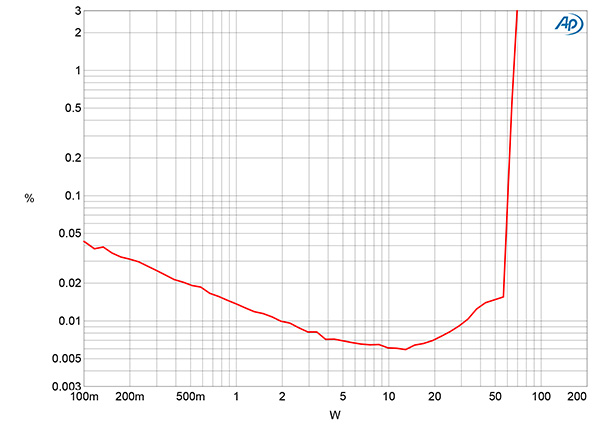
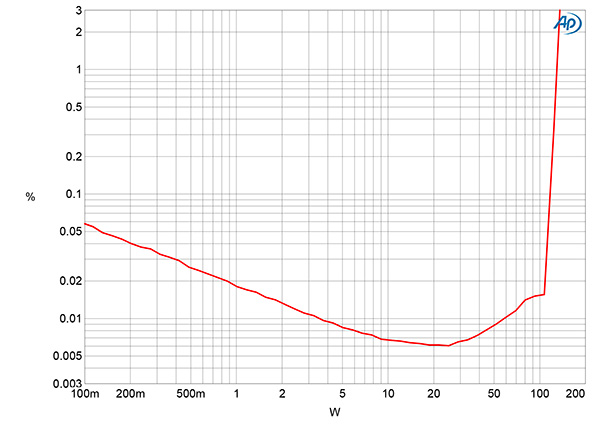
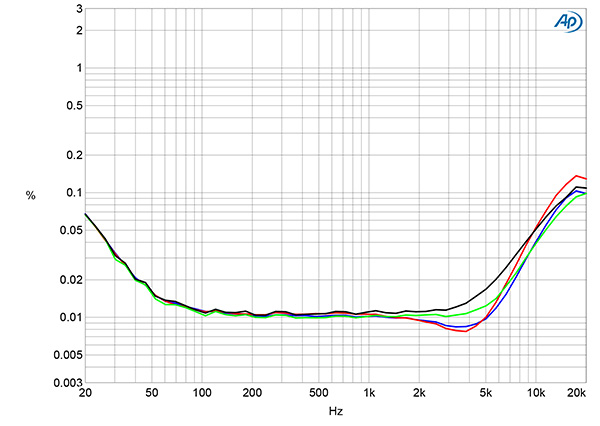
The WiiM's maximum power is specified as 60Wpc into 8 ohms, 120Wpc into 4 ohms, both equivalent to 17.4dBW. Stereophile defines an amplifier's clipping power as being when the THD+noise reaches 1%. With that criterion and with both channels driven, the Amp clipped at 66Wpc into 8 ohms (fig.7) and 129Wpc into 4 ohms (fig.8), both powers equivalent to 18.1dBW. The downward slope of the traces below 15W in figs.7 and 8 is due to the actual distortion lying beneath the random noisefloor. I therefore examined how the THD+N percentage varied with frequency at 12.67V, which is equivalent to 20W into 8 ohms and 40W into 4 ohms. The THD+N percentage was very low from 100Hz to 3kHz into both 8 ohms and 4 ohms (fig.9) but rose at the frequency extremes.
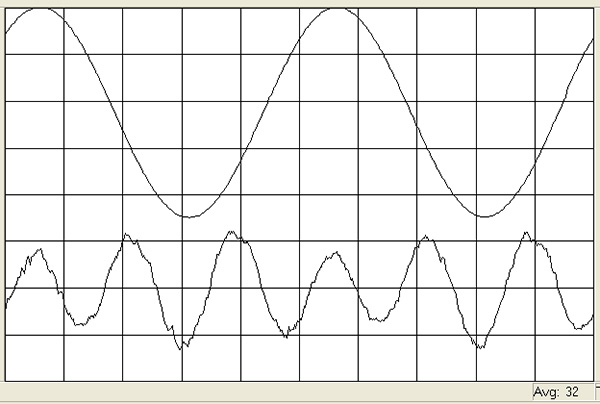
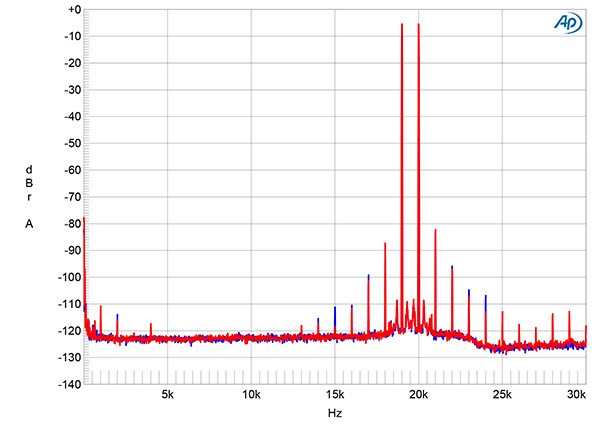
With a 1kHz signal at 20Wpc into 8 ohms, the distortion waveform was predominantly the third harmonic at 0.01% (fig.10). At low frequencies, the rise in THD+N seen in fig.8 was due to the second harmonic rising above the third (fig.11). With an equal mix of 19 and 20kHz tones at the same peak power into 8 ohms (fig.12), the second-order difference product at 1kHz lay close to –110dB (0.0003%). The higher-order intermodulation products were higher in level, though still very low in absolute terms. The intermodulation distortion remained very low at 40Wpc into 4 ohms (not shown).—John Atkinson


