Sidebar 4: Vandersteen M7-HPA Measurements
I performed a full suite of measurements on one of the Vandersteen M7-HPA amplifiers (serial no.107), using my Audio Precision SYS2722 system (see www.ap.com and the January 2008 "As We See It"). I preconditioned the amplifier by running it at one-third the specified power, 100W, into 8 ohms for 60 minutes. At the end of that time, its heatsinks were warm, at 112.4°F (44.7°C). The percentage of THD+noise at this power level was 0.07%.
A note on the measurements: the M7-HPA's hair-trigger protection caused it to shut down several times during the measurements, mostly when I was asking it to drive high powers into low impedances without ramping up the input signal. For example, if I hit the amplifier with a sinewave signal equivalent to a continuous output of 50W into 8 ohms, it went into protection. Every time, turning the amplifier back on brought it successfully back to life. I never had this problem when listening to music.
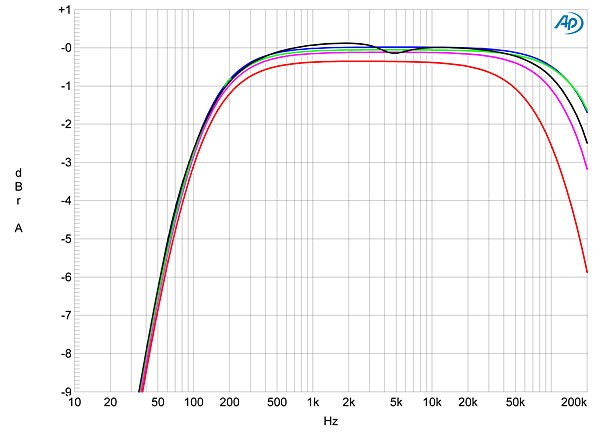
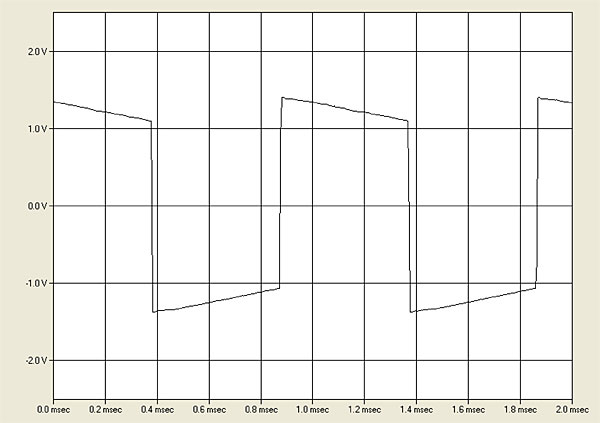
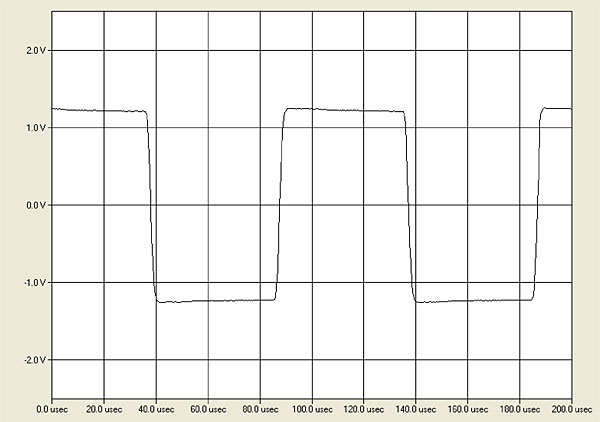
The Vandersteen's voltage gain at 1kHz into 8 ohms was 24.7dB, and the amplifier preserved absolute polarity (ie, was non-inverting). (The input XLR is wired with pin 2 hot.) The input impedance was very high, ranging from 700k ohms at 20Hz to 210k ohms at 20kHz. The output impedance was a little higher than usual for a design with a solid-state output stage, presumably due to the two output stages being in series with the load, at 0.27 ohm at 20Hz, 0.23 ohm at 1kHz, and 0.25 ohm at 20kHz. This impedance resulted in a response variation of ±0.15dB into our standard simulated loudspeaker (fig.1, gray trace). This graph reveals the high-pass function, with a –3dB point at 90Hz and an ultimate 6dB/octave rolloff—this behavior was the same from both sets of outputs—which results in the expected sloped tops and bottoms with a 1kHz squarewave (fig.2). At the other end of the spectrum, the M7-HPA's response extended to –1.5dB at 200kHz into 8 ohms (fig.1, blue trace), which correlates with the excellent shape of a 10kHz squarewave (fig.3).
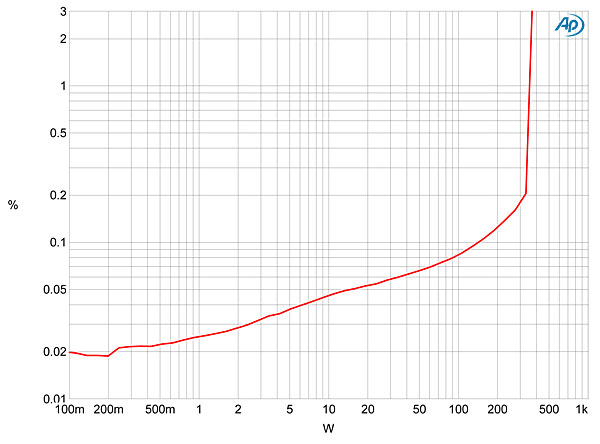
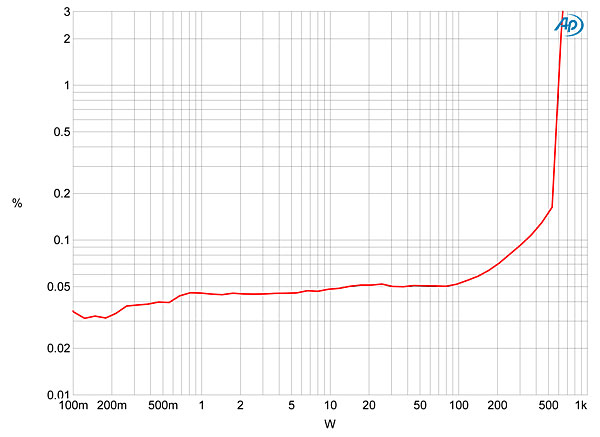
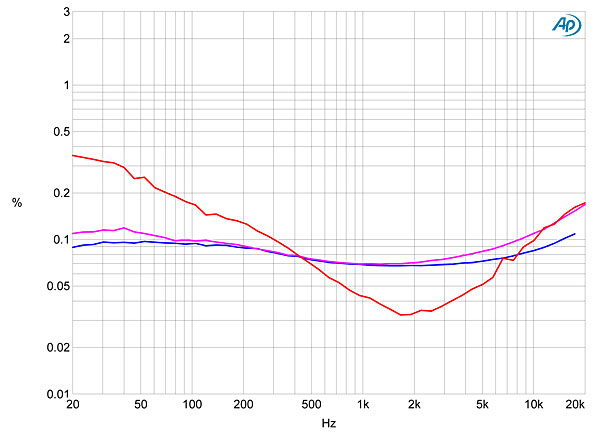
 Figs. 5 and 6 plot the THD+noise percentage against power into 8 and 4 ohms. The M7-HPA clipped (defined as when the THD+N reaches 1%) at 350W into 8 ohms (25.4dBW) and 600W into 4 ohms (24.8dBW), the latter confirming the specified maximum power. Into 8 ohms (fig.5), the THD+N rose in linear fashion as the power increased, starting from a low 0.02% at 100mW, but remained more constant into 4 ohms (fig.6). Fig.7 shows how the THD+N percentage changed with frequency at a moderately high level, 20V, equivalent to 50W into 8 ohms (blue trace), 100W into 4 ohms (magenta), and 200W into 2 ohms (red). To my surprise, the distortion was lower in the midrange and low treble into 2 ohms than it was into the higher impedances.
 I was about to write that the M7-HPA measures well for an amplifier with zero loop-negative feedback. Actually, it measures well, period.—John Atkinson
Fig.1 Vandersteen M7-HPA, Tweeter Midrange frequency response at 2.83V into: simulated loudspeaker load (gray), 8 ohms (blue), 4 ohms (magenta), 2 ohms (red); Mid Bass Bass frequency response at 2.83V into 8 ohms (green) (1dB/vertical div.).
Fig.2 Vandersteen M7-HPA, small-signal 1kHz squarewave into 8 ohms.
Fig.3 Vandersteen M7-HPA, small-signal 10kHz squarewave into 8 ohms.
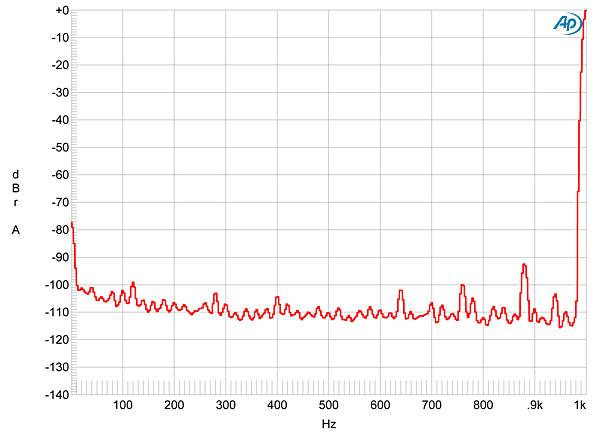
The M7-HPA was a little noisier than the norm, the unweighted, wideband signal/noise ratio (ref. 2.83V into 8 ohms and taken with the input shorted to ground) measuring 68.2dB and due primarily to random noise (fig.4). A-weighting the measured ratio improved it to a respectable 93.1dB.
Fig.4 Vandersteen M7-HPA, spectrum of 1kHz sinewave, DC–1kHz, at 1W into 8 ohms (linear frequency scale).
Fig.5 Vandersteen M7-HPA, distortion (%) vs 1kHz continuous output power into 8 ohms.
Fig.6 Vandersteen M7-HPA, distortion (%) vs 1kHz continuous output power into 4 ohms.
Fig.7 Vandersteen M7-HPA, THD+N (%) vs frequency at 20V into: 8 ohms (blue), 4 ohms (magenta), 2 ohms (red).
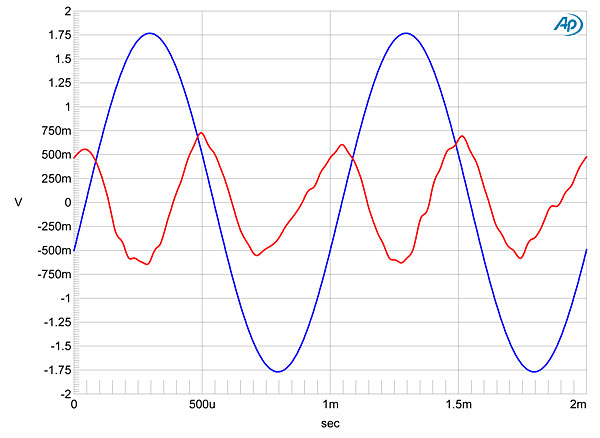
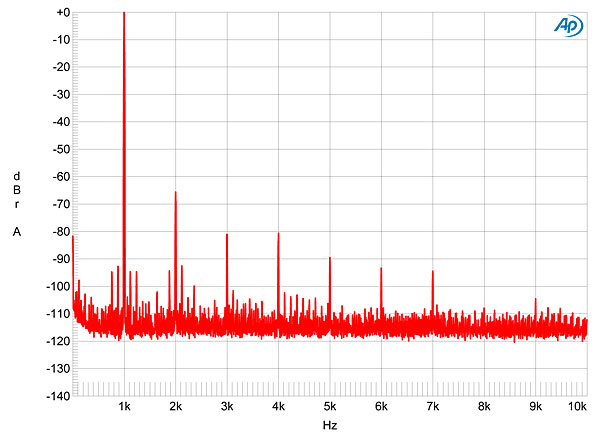
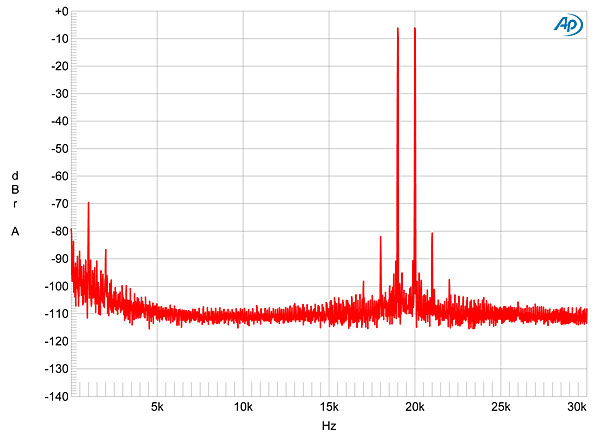
The M7-HPA's distortion was predominantly the subjectively benign second harmonic (fig.8), though at high output currents, higher-order harmonics appeared and AC supply-related sidebands can be seen, albeit at low levels (fig.9). These sidebands can also be seen in fig.10, a spectral analysis of the M7-HPA's output as it drove an equal mix of 19 and 20kHz tones at 100W into 4 ohms. Despite the high power, the difference product at 1kHz lies at a low –70dB (0.03%), with very few higher-order spuriae visible.
Fig.8 Vandersteen M7-HPA, 1kHz waveform at 50W into 4 ohms, 0.07% THD+N (blue); distortion and noise waveform with fundamental notched out (red, not to scale).
Fig.9 Vandersteen M7-HPA, spectrum of 1kHz sinewave, DC–10kHz, at 100W into 4 ohms (linear frequency scale).
Fig.10 Vandersteen M7-HPA, HF intermodulation spectrum, DC–30kHz, 19+20kHz at 100W peak into 4 ohms (linear frequency scale).


