Sidebar 3: Measurements
I tested the T+A PA 3100 HV with my Audio Precision SYS2722 system (see the January 2008 "As We See It"). The review sample did not have the Tone Control/Room Correction module fitted and neither did it have the optional PS 3000 HV auxiliary power supply. I looked first at its behavior via its line inputs, mostly with the volume control set to its maximum of "99," and then at lower settings. (The volume control operates in accurate 0.5dB steps.) The front-panel meters are correctly calibrated, a power of 1W into 8 ohms being shown as "1W." I preconditioned the amplifier by following the CEA's recommendation of operating it at one-eighth the specified power into 8 ohms for 30 minutes. At the end of that time, the heatsinks were very hot, at 131.6°F (55.4°C), and the top panel's temperature was 103.6°F (39.8°C).
The maximum gain at the loudspeaker outputs was 40.6dB for the balanced inputs, 45.6dB for the single-ended inputs. At the headphone outputs, the maximum gain measured 20.7dB and 25.7dB, respectively. The maximum gain at the preamplifier output was 14.45dB for the balanced inputs to the balanced output and 13.4dB for the unbalanced inputs to the unbalanced output. The PA 3100 HV preserved absolute polarity (ie, was noninverting) at all of its outputs.
The PA 3100 HV's unbalanced line input impedance is specified at 20k ohms, which was confirmed by my measurements. The balanced input impedance was 41k ohms. The preamplifier output impedance was 44 ohms across the band for the unbalanced output, 89 ohms for the balanced output. The headphone output impedance was a moderately high 47 ohms across the audioband—50 ohms is specified—meaning that low-impedance headphones will not be driven optimally by the T+A amplifier.
The amplifier's output impedance was 0.15 ohms at 20Hz and 1kHz, rising slightly to 0.17 ohms at 20kHz. (The measured values include the series impedance of 6' of spaced-pair speaker cable.) The modulation of the amplifier's frequency response, due to the Ohm's law interaction between this source impedance and the impedance of our standard simulated loudspeaker, was minimal (fig.1, gray trace). The small-signal bandwidth into resistive loads with the volume control set to its maximum was flat to 20kHz, and there was no overshoot or ringing with the amplifier's reproduction of a 10kHz squarewave (fig.2). Channel matching was excellent and maintained at lower settings of the volume control. The response at the headphone jack and the balanced preamplifier output was flat in the audioband and –2.5dB at 200kHz. At the single-ended preamplifier output, the response was down by 1.5dB at 100kHz.
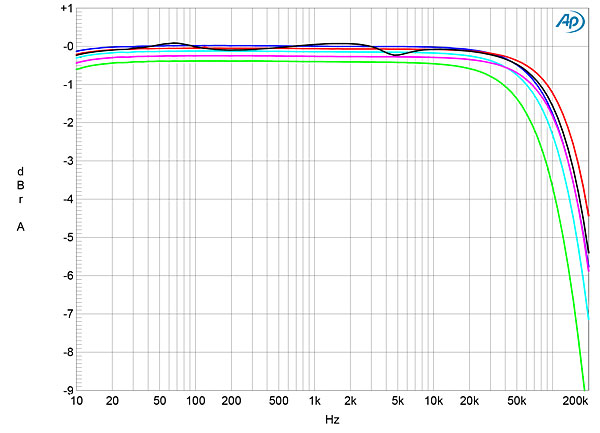
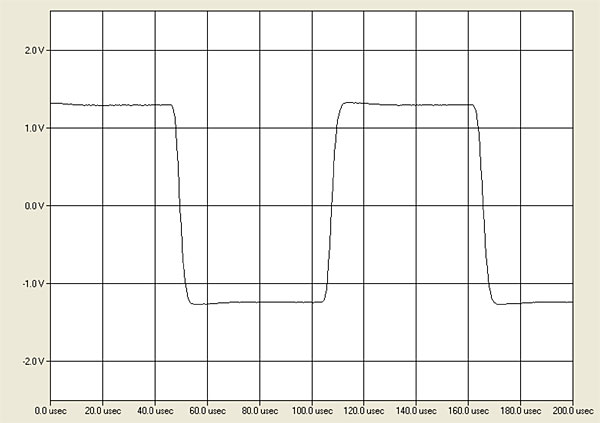
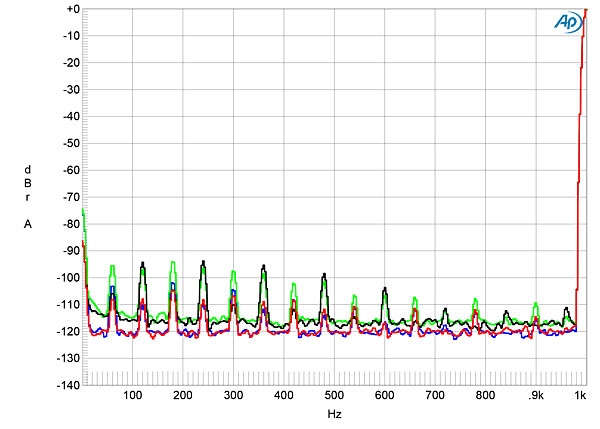
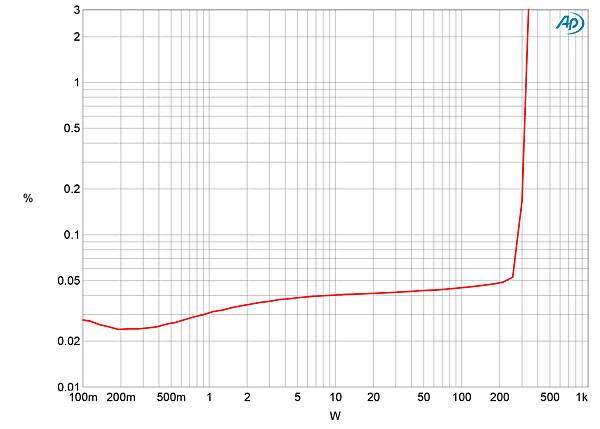
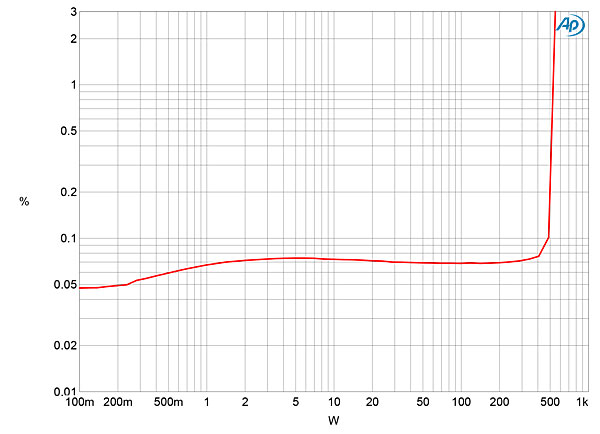
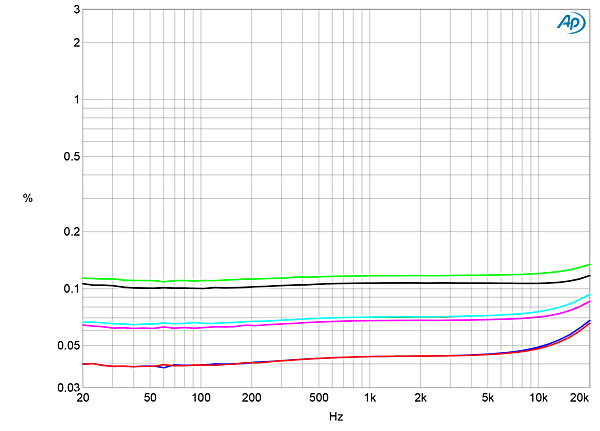
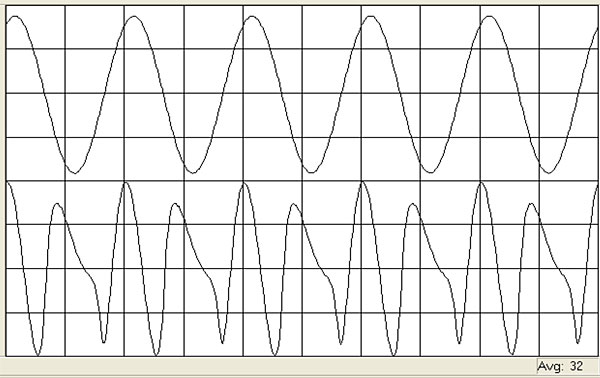
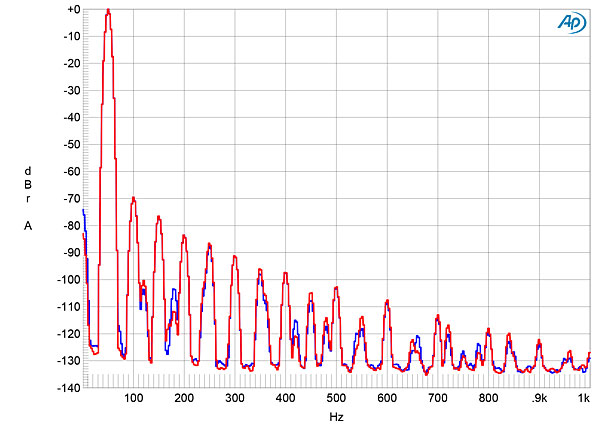
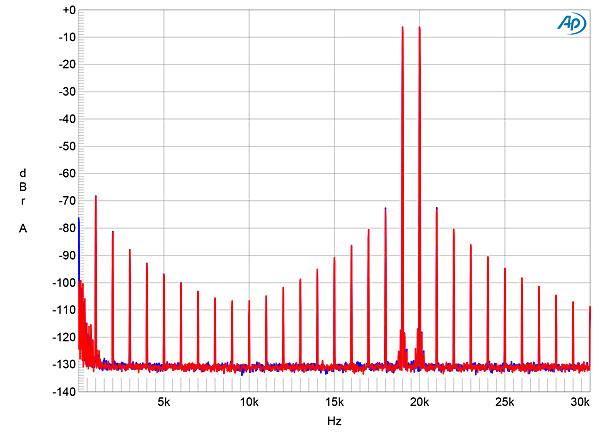
Fig.1 T+A PA3100 HV, frequency response at 2.83V into: simulated loudspeaker load (gray), 8 ohms (left channel blue, right red), 4 ohms (left cyan, right magenta), 2 ohms (green) (1dB/vertical div.).
Fig.02 T+A PA3100 HV, small-signal 10kHz squarewave into 8 ohms.
Channel separation via the line inputs (not shown) was excellent, at 90dB in both directions below 2kHz and still >80dB at the top of the audioband. The wideband, unweighted S/N ratio, taken with the unbalanced input shorted to ground and the volume control set to its maximum, was a good 69dB (average of both channels), ref. 2.83V output into 8 ohms. Restricting the measurement bandwidth to the audioband increased the ratio to 78dB, while switching an A-weighting filter into the circuit further improved the ratio to 81.1dB. The level of the PA 3100 HV's noise floor depended on the volume control setting. With the control set to its maximum ("99"), low-level supply-related spuriae at 60Hz and its odd and even harmonics were visible in the amplifier's low-frequency output spectrum (fig.3, green and gray traces); these were lowered by 10–15dB when the control was set to –20dB ("79") (fig.3, blue and red traces).
Fig.3 T+A PA3100 HV, spectrum of 1kHz sinewave, DC–1kHz, at 1W into 8 ohms with volume control set to "79" (left channel blue, right red) and "99" (left green, right gray, linear frequency scale).
T+A specifies the PA 3100 HV's maximum continuous power as 300W into 8 ohms (24.8dBW) and 500W into 4 ohms (24.0dBW). With both channels driven and using our definition of clipping, which is when the output's percentage of THD+noise reaches 1%, fig.4 indicates that the amplifier clipped at 318Wpc into 8 ohms (25.0dBW). The T+A amplifier also exceeded its specified power into 4 ohms, clipping at 525Wpc (24.2dBW), again with both channels driven (fig.5). (I don't hold the AC wall voltage constant for these tests. With the amplifier idling, it was 121.6V; with the amplifier clipping into 4 ohms, the AC supply voltage had dropped to 117.9V.)
Fig.4 T+A PA3100 HV, distortion (%) vs 1kHz continuous output power into 8 ohms.
Fig.5 T+A PA3100 HV, distortion (%) vs 1kHz continuous output power into 4 ohms.
I measured how the PA 3100 HV's distortion changed with frequency at 20V, which is equivalent to 50W into 8 ohms, 100W into 4 ohms, and 200W into 2 ohms. The THD+N percentage was very low into both 8 ohms (fig.6, blue and red traces) and 4 ohms (cyan, magenta traces). It did rise above 0.1% into 2 ohms (green, gray traces), but there was no rise in THD+N in the top octaves, which implies a commendably wide open-loop bandwidth. The distortion was predominantly the second harmonic (fig.7), with the higher harmonics decreasing in a linear manner with frequency (fig.8). Despite the good high-frequency linearity seen in fig.6, there was a greater amount of intermodulation distortion with an equal high-power mix of 19kHz and 20Hz tones than I was anticipating (fig.9). However, the highest-level intermodulation products still lay at or below –70dB (0.03%).
Fig.6 T+A PA3100 HV, THD+N (%) vs frequency at 20V into: 8 ohms (left blue, right red), 4 ohms (left cyan, right magenta), and 2 ohms (left green, right gray).
Fig.7 T+A PA3100 HV, 1kHz waveform at 50W into 8 ohms, 0.044% THD+N (top); distortion and noise waveform with fundamental notched out (bottom, not to scale).
Fig.8 T+A PA3100 HV, spectrum of 50Hz sinewave, DC–1kHz, at 50Wpc into 8 ohms (left channel blue, right red, linear frequency scale).
Fig.9 T+A PA3100 HV, HF intermodulation spectrum, DC–30kHz, 19+20kHz at 100Wpc peak into 4 ohms (linear frequency scale).
Overall, the T+A PA 3100 HV performed very well on the test bench. It exceeded its specified power, and while distortion is not especially low, it is commendably consistent with frequency and consists primarily of the subjectively innocuous second harmonic with higher-order harmonics declining with increasing frequency.—John Atkinson


