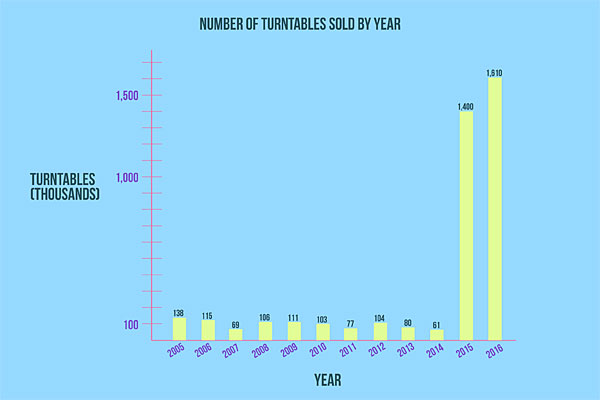
The graphic above was created with data provided to me by the CTA (Consumer Technology Association). I understand that this data cannot possibly account for every single turntable sold in any given year, but I believe that this is the most accurate account of data currently available to us.
I deliberately chose not to include LP sales data, because I believe turntable sales data to be more valuable alone. These figures represent people discovering or rediscovering their newfound appreciation for turntables, rather than existing turntable owners listening to (or collecting) more LPs. It represents a commitment. It is also worth noting that gross annual CD player sale data is not included here because the CTA stopped collecting that data after 2005.
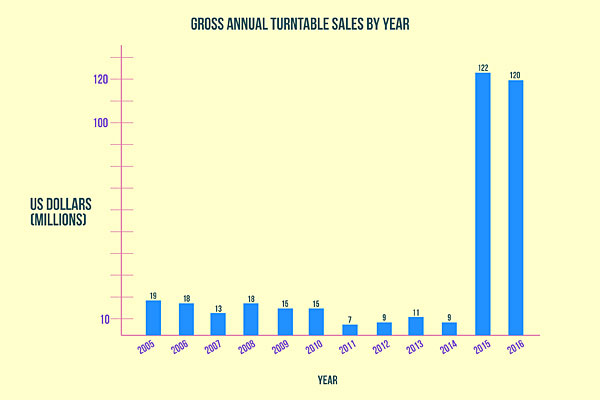 When looking at these figures, it is important that we understand how wide the "turntables" category really is. The jump in 2008 is likely connected to the start of Record Store Day, and the spike in 2015 clearly reflects the monumental comeback of vinyl.
Beyond that, there are many more unanswered variables. Is there a direct correlation between turntable sales and the audiophile population? What percentage of these units is used for DJing? How many of these units are Crosleys sold by Urban Outfitters? What about the number of used sales and trades? What about the rest of their setup? Do they care about sound quality? What is the ratio of affordable quantity versus less affordable quality in these numbers? What demographic is responsible for most of these purchases? And so on.
However, while these variables are all worth considering, it is most important to realize that people are listening more and there are more people listening.
When looking at these figures, it is important that we understand how wide the "turntables" category really is. The jump in 2008 is likely connected to the start of Record Store Day, and the spike in 2015 clearly reflects the monumental comeback of vinyl.