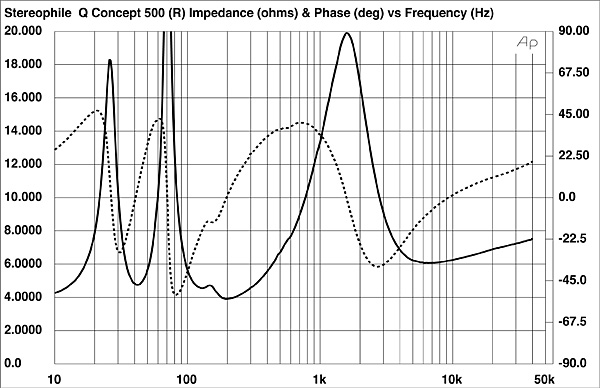
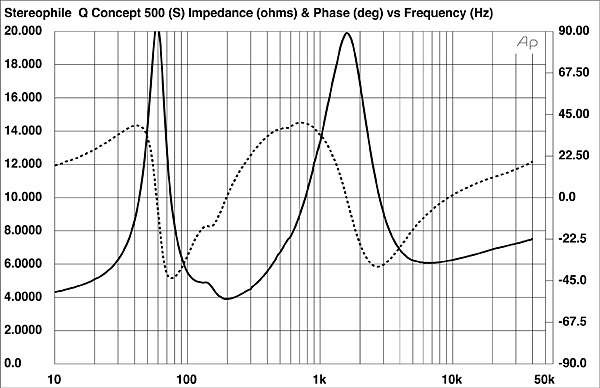
I used DRA Labs' MLSSA system and a calibrated DPA 4006 microphone to measure the Q Acoustics Concept 500's frequency response in the farfield, and an Earthworks QTC-40 microphone for the nearfield responses. Q Acoustics specifies the Concept 500's sensitivity as 90dB/W/m; my estimate was close to that, at 89.2dB(B)/2.83V/m, which is usefully higher than average. The Concept 500's impedance is specified as 6 ohms, with a minimum magnitude of 3.7 ohms. Fig.1 shows how the Concept 500's impedance and electrical phase varied with frequency with its reflex port open. Though the magnitude does drop below 6 ohms in the midrange, with a minimum value of 3.9 ohms at 193Hz, and there is a current-demanding combination of 5.5 ohms and –39° electrical phase angle at 99Hz, the Concept 500 will not be a particularly difficult load for an amplifier to drive. With the port blocked with the supplied foam plug, the impedance plot (fig.2) indicates that the Concept 500 behaves as a sealed-box design with a woofer tuning frequency of a relatively high 59Hz.
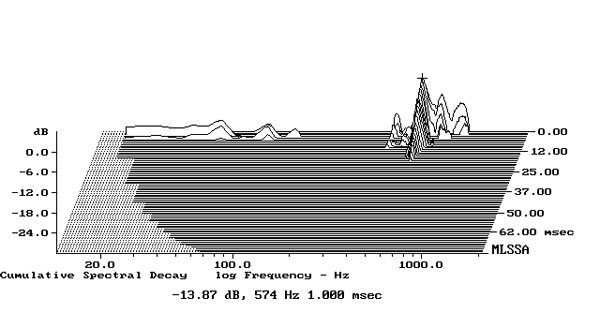
When I investigated the enclosure's vibrational behavior with a plastic-tape accelerometer, it seemed relatively inert. Fig.3 shows a cumulative spectral-decay plot calculated from the accelerometer's output when it was fastened to the front baffle midway between the lower woofer and the speaker's base. I did find some resonant modes in the midrange on all surfaces, but these are all low in level.
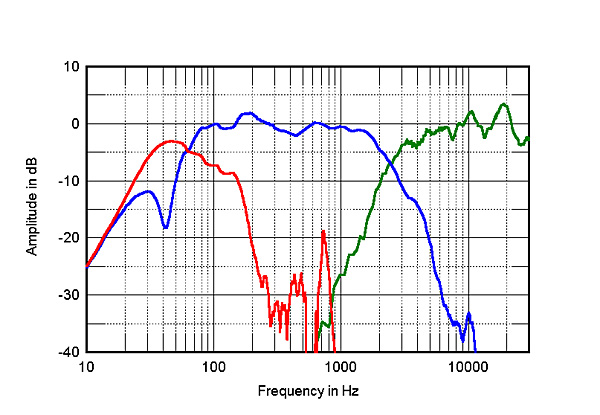
With the port open, the impedance plot has a saddle in the magnitude trace centered on 42Hz (the lowest note of the four-string double bass and bass guitar), which suggests that this is the woofers' reflex tuning frequency. The two woofers behaved identically, and when measured in the nearfield had the expected minimum-motion notch in their outputs at 42Hz (fig.4, blue trace). The port's output (red trace) peaks between 30 and 90Hz, but its upper-frequency rolloff is disturbed by a shelf at around 150Hz, the frequency of a small bump in the impedance-magnitude trace. There is also a sharply defined resonance at 710Hz in the port's output, but this is 20dB down compared with the woofer's level, and its audibility will be further reduced by the fact that the port fires to the speaker's rear. Higher in frequency in fig.4, the woofers (blue trace) are crossed over to the tweeter (green) at the specified 2.5kHz.
In fig.5, the black trace below 300Hz shows the complex sum of the nearfield woofer and port responses, taking into account acoustic phase and the different distances of each radiator from a nominal farfield microphone position. The nearfield measurement technique assumes that the drive-unit is mounted in a true infinite baffle—ie, one that extends to infinity in both the vertical and horizontal planes—and this results in a peak in the upper bass with a speaker that is actually maximally flat in the bass. The Concept 500 has only a small bass peak, which implies that its woofer tuning is optimized more for definition than for weight, as TJN found. However, the boundary reinforcement in the low bass, due to the fact that the port is placed close to the floor, will result in a better balance of clarity and weight in the low frequencies.
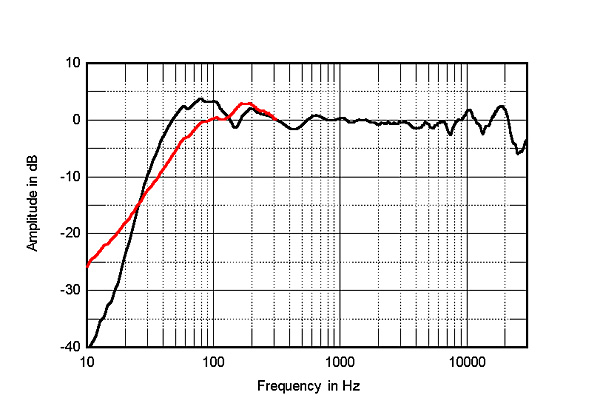
The red trace in fig.5 shows the nearfield output of the woofers with the port sealed. It rolls off below 80Hz with the expected 12dB/octave slope compared with the reflex tuning's 24dB, but this suggests that the speaker will sound lean with the port blocked.
Above 300Hz in fig.5, the black trace shows the Concept 500's farfield response, averaged across a 30° horizontal window centered on the tweeter axis. It is superbly flat. This graph was taken with the rear-panel jumper set to its Normal position. With the jumper set to More Treble or Less Treble, the tweeter's output was respectively raised or lowered by approximately 0.5dB.
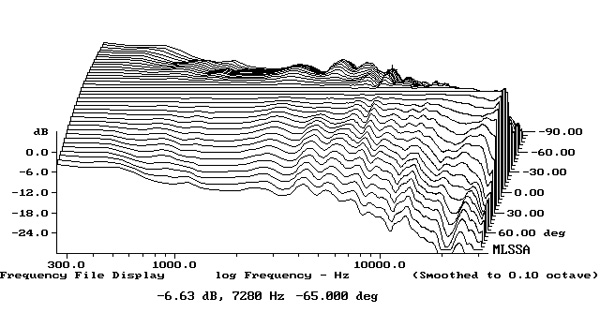
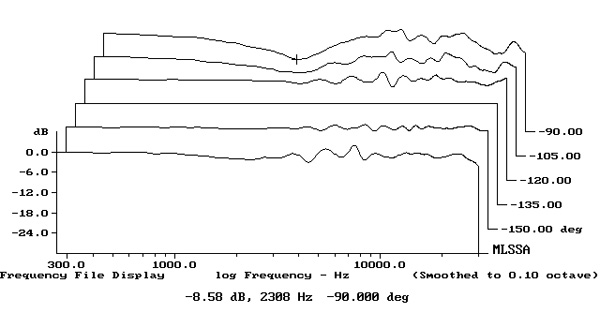
The plot of the Concept 500's horizontal dispersion (fig.6) indicates a well-controlled radiation pattern. The evenly spaced contour lines in this graph suggest that a pair of these speakers will offer stable stereo imaging, due to the fact that their direct sound and the reflections of that sound from the room's sidewalls will not have different characters. In the vertical plane (fig.7), the Concept 500 is not fussy about having the listener's ears the same height from the ground as the tweeter (37" with the speaker on its spikes).
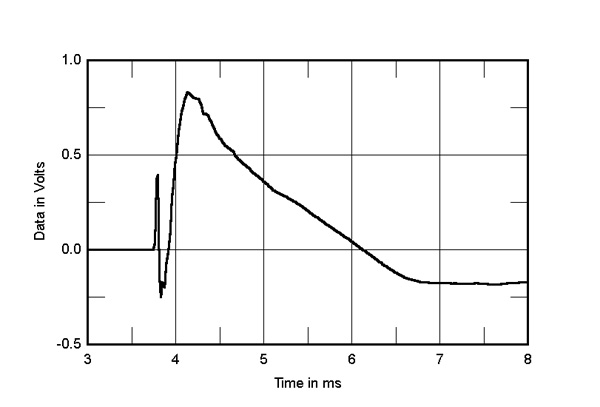
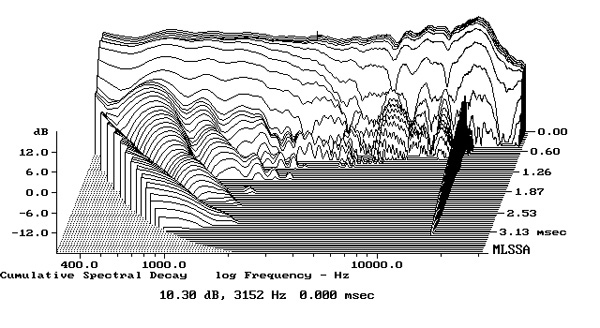
In the time domain, the Concept 500's step response (fig.8) indicates that the tweeter and woofers are connected in positive polarity. The decay of the tweeter's step blends smoothly with the start of the woofers' step, suggesting optimal crossover design. The Q's cumulative spectral-decay plot (fig.9) was superbly clean.
I was impressed by the Concept 500's measured performance. It exemplifies textbook loudspeaker design.—John Atkinson


