Sidebar 3: Measurements
I used DRA Labs' MLSSA system and a calibrated DPA 4006 microphone with an Earthworks microphone preamplifier to measure the Mission 770's farfield frequency behavior and dispersion. I used an Earthworks QTC-40 mike for the nearfield and in-room responses and Dayton Audio's DATS V2 system to measure the impedance magnitude and electrical phase angle.
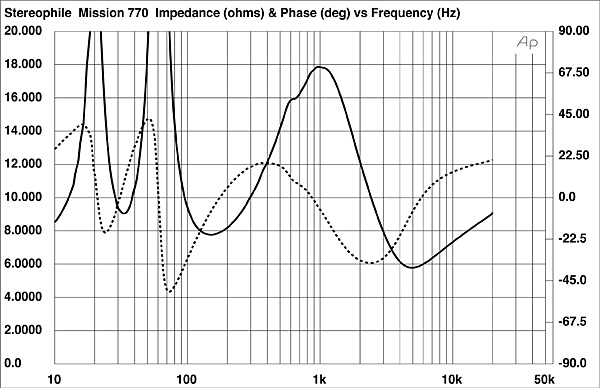
Mission specifies the 770's anechoic sensitivity as 88dB/2.83V/m. My B-weighted estimate was lower, at 85.5dB/2.83V/m, which is the same as that measured by Paul Miller for our sister magazine, Hi-Fi News. The 770's impedance, specified as 8 ohms, remains higher than 8 ohms for most of the audioband (fig.1, solid trace) but drops to just below 6 ohms in the mid-treble region. The electrical phase angle (dashed trace) is mostly low, though it does reach –51° at 74Hz, a frequency where the magnitude is high. The effective resistance, or EPDR (footnote 1), is generally benign, though it drops below 4 ohms between 85Hz and 116Hz and between 2.3kHz and 4.9kHz. The minimum EPDR is 3.7 ohms at 96Hz and 3 ohms between 3.35kHz and 3.9kHz. The 770 shouldn't be a difficult load for amplifiers, though tubed designs will best be used from their 4 ohm taps.
 The black trace above 300Hz in fig.3 shows the 770's quasi-anechoic farfield response, averaged across a 30° horizontal window centered on the tweeter axis. The response trend is even, though there is a very slight lack of energy between 3kHz and 9kHz (footnote 2). The pair matching between the two samples was excellent, meeting ±0.5dB limits between 400Hz and 20kHz, though the narrow suckout between 3kHz and 4kHz was deeper in the left-hand speaker's response. The trace in fig.3 was taken without the somewhat bulky grille. Repeating the response measurement with the grille reduced the level above 3kHz by 1–2dB.
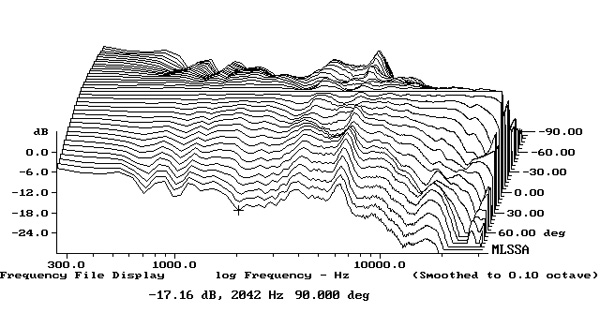
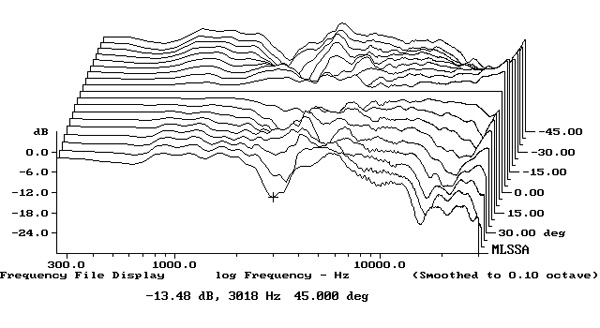
Fig.4 shows the 770's horizontal dispersion, normalized to the response on the tweeter axis, which thus appears as a straight line. The radiation pattern narrows somewhat at the top of the woofer's passband before widening when the tweeter takes over. The two on-axis suckouts in the mid-treble tend to fill in to the speaker's sides and the tweeter starts to become directional above 12kHz, which implies that the optimal top-octave response will be obtained when the speakers are toed-in to the listening position. Fig.5 shows the speaker's dispersion in the vertical plane, again normalized to the tweeter-axis response, which is 37" from the floor. The mid-treble depression deepens 5° below the tweeter axis but tends to fill in 5° above the tweeter axis. A suckout at the crossover frequency develops more than 10° above and below the reference axis.
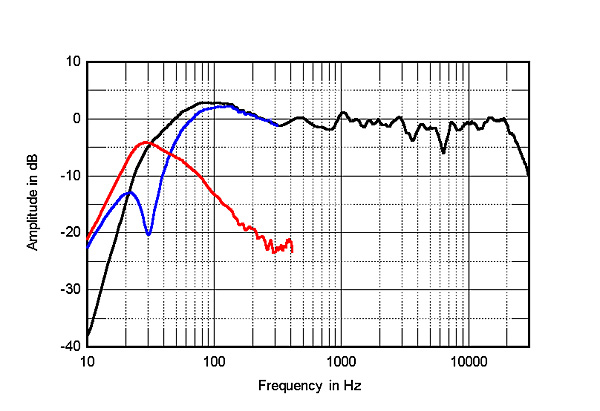
The black trace above 300Hz in fig.3 shows the 770's quasi-anechoic farfield response, averaged across a 30° horizontal window centered on the tweeter axis. The response trend is even, though there is a very slight lack of energy between 3kHz and 9kHz (footnote 2). The pair matching between the two samples was excellent, meeting ±0.5dB limits between 400Hz and 20kHz, though the narrow suckout between 3kHz and 4kHz was deeper in the left-hand speaker's response. The trace in fig.3 was taken without the somewhat bulky grille. Repeating the response measurement with the grille reduced the level above 3kHz by 1–2dB.
Fig.4 shows the 770's horizontal dispersion, normalized to the response on the tweeter axis, which thus appears as a straight line. The radiation pattern narrows somewhat at the top of the woofer's passband before widening when the tweeter takes over. The two on-axis suckouts in the mid-treble tend to fill in to the speaker's sides and the tweeter starts to become directional above 12kHz, which implies that the optimal top-octave response will be obtained when the speakers are toed-in to the listening position. Fig.5 shows the speaker's dispersion in the vertical plane, again normalized to the tweeter-axis response, which is 37" from the floor. The mid-treble depression deepens 5° below the tweeter axis but tends to fill in 5° above the tweeter axis. A suckout at the crossover frequency develops more than 10° above and below the reference axis.
 As is to be expected from their size, the floorstanding Audiovectors have both the best upper-bass balance and the most extended low frequencies, while the Q Acoustics speakers are lacking in mid- and upper-bass energy. (As I explained in my review, I wasn't able to position the Concept 50s as close to the wall behind them as they required.) The 770s fall between the two other speakers in this region. The Mission and Q Acoustics speakers offer similarly smooth behavior in the midrange and treble, while the Audiovectors have more energy at the top of the midrange, which I described in my review as adding a touch of "character" in this region.
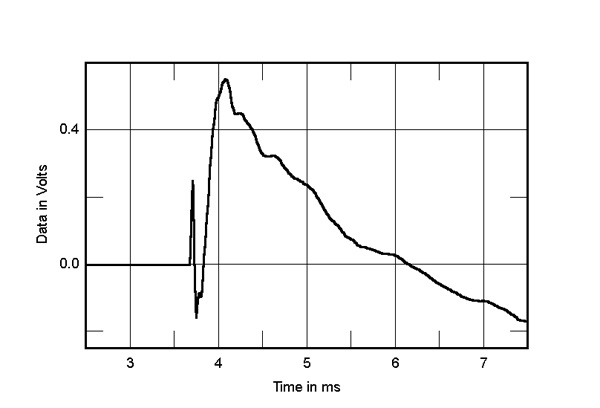
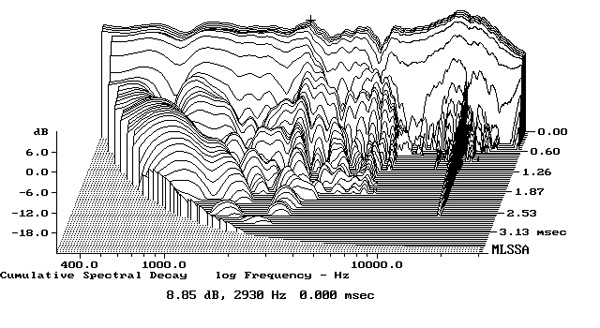
Turning to the time domain, the 770's step response (fig.7) indicates that the tweeter and woofer are connected in positive acoustic polarity. The decay of the tweeter's step, which arrives first at the microphone, doesn't quite blend smoothly with the start of the woofer's step. This suggests that the optimal blend of the two units' output will occur just below the tweeter axis. The 770's cumulative spectral-decay plot (fig.8) features a very clean initial decay, though some delayed energy is present at the top of the woofer's passband.
As is to be expected from their size, the floorstanding Audiovectors have both the best upper-bass balance and the most extended low frequencies, while the Q Acoustics speakers are lacking in mid- and upper-bass energy. (As I explained in my review, I wasn't able to position the Concept 50s as close to the wall behind them as they required.) The 770s fall between the two other speakers in this region. The Mission and Q Acoustics speakers offer similarly smooth behavior in the midrange and treble, while the Audiovectors have more energy at the top of the midrange, which I described in my review as adding a touch of "character" in this region.
Turning to the time domain, the 770's step response (fig.7) indicates that the tweeter and woofer are connected in positive acoustic polarity. The decay of the tweeter's step, which arrives first at the microphone, doesn't quite blend smoothly with the start of the woofer's step. This suggests that the optimal blend of the two units' output will occur just below the tweeter axis. The 770's cumulative spectral-decay plot (fig.8) features a very clean initial decay, though some delayed energy is present at the top of the woofer's passband.
Footnote 1: EPDR is the resistive load that gives rise to the same peak dissipation in an amplifier's output devices as the loudspeaker. See "Audio Power Amplifiers for Loudspeaker Loads," JAES, Vol.42 No.9, September 1994, and stereophile.com/reference/707heavy/index.html.
Footnote 2: Designer Peter Comeau wrote in an email: "The original treble unit has a slightly raspy character which Farad diminished by reducing its level between 2 and 7kHz. . . . Thanks to the improved treble unit I'm now using, I have raised the level a tad in comparison. But keeping the treble a touch below the midband level seems to emphasize the mid contribution to music (of course), as well as making the speakers more suitable for all styles of music (meaning you don't have to stick to audiophile recordings)! It is that character that I wanted to keep intact."
Footnote 3: Using the FuzzMeasure 3.0 program, a Metric Halo MIO2882 FireWire-connected audio interface, and a 96kHz sample rate, I average 20 1/6-octave–smoothed spectra, individually taken for the left and right speakers, in a rectangular grid 36" wide by 18" high and centered on the positions of my ears.
Fig.1 Mission 770, electrical impedance (solid) and phase (dashed) (2 ohms/vertical div.).
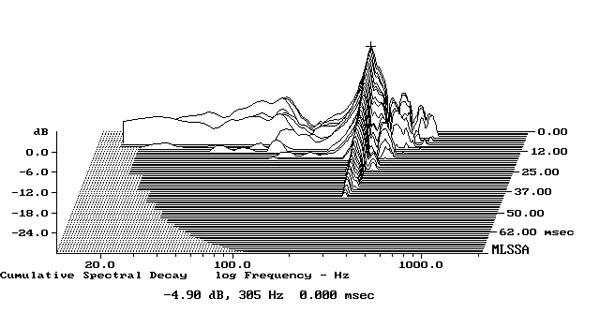
The traces in fig.1 are free from the small discontinuities in the midrange that would imply the existence of cabinet resonances of various kinds. Nevertheless, when I investigated the enclosure's vibrational behavior with a plastic-tape accelerometer, I found a resonant mode at 305Hz that was present on all the panels (fig.2). This mode has a high Q (Quality Factor), which will work against audibility. In addition, at 305Hz the resonance falls between the frequencies of the notes D (approximately 294Hz) and E flat (311Hz) above Middle C in the Equal Temperament musical scale, which will reduce the possibility that it will be excited in music.
Fig.2 Mission 770, cumulative spectral-decay plot calculated from output of accelerometer fastened to center of sidewall level with the woofer (MLS driving voltage to speaker, 7.55V; measurement bandwidth, 2kHz).
The saddle at 30Hz in the magnitude trace reveals that this is the tuning frequency of the flared port. The red trace in fig.3 shows the response of the port, measured in the nearfield. The output reaches its maximum at the tuning frequency, and the upper-frequency rollout is clean. (I have truncated at 500Hz the trace showing the port's response, as the measurement was contaminated by crosstalk from the adjacent woofer at higher frequencies.) The woofer's nearfield output (blue trace) has the expected minimum-motion notch at the port tuning frequency, and while the complex sum of the woofer and port responses (black trace below 300Hz in fig.3) has a 3dB rise in the midbass response, this will be mostly due to the nearfield measurement technique, which assumes the drive units are mounted in a true infinite baffle. The 770's woofer alignment is close to being maximally flat, with the –6dB point lying at the port tuning frequency, as specified.
Fig.3 Mission 770, anechoic response on tweeter axis at 50", averaged across 30° horizontal window and corrected for microphone response, with the nearfield responses of the woofer (blue), and port (red) and their complex sum (black), respectively plotted below 300Hz, 500Hz, and 300Hz.
Fig.4 Mission 770, lateral response family at 50", normalized to response on tweeter axis, from back to front: differences in response 90–5° off axis, reference response, differences in response 5–90° off axis.
Fig.5 Mission 770, vertical response family at 50", normalized to response on tweeter axis, from back to front: differences in response 45–5° above axis, reference response, differences in response 5–45° below axis.
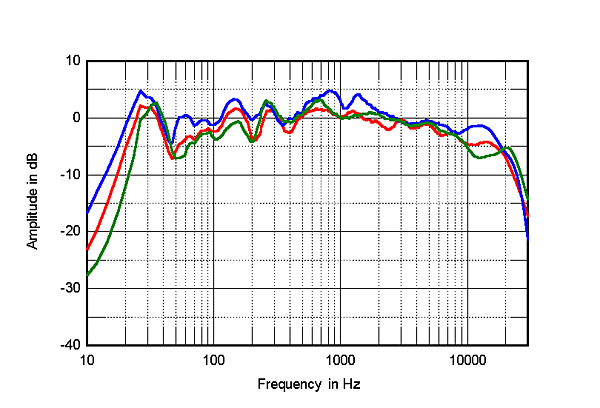
The red trace in fig.6 shows the Mission 770s' spatially averaged response in my listening room (footnote 3). The in-room response is reasonably even from 100Hz to 5kHz, with then the expected gentle slope down in response. This is primarily due to the increased absorption of the room's furnishings as the frequency increases. The Missions cost $5000/pair. For reference, the blue trace in fig.6 shows the spatially averaged response of the Audiovector QR7s ($6500/pair), which I reviewed in September 2022, and the green trace that of the Q Acoustics Concept 50s ($2995/pair), which I reviewed in August 2022. (The traces are plotted to be equal in level in the middle of the midrange and the mid-treble.)
Fig.6 Mission 770, spatially averaged, 1/6-octave response in JA's listening room (red), of the Audiovector QR 7 (blue), and of the Q Acoustics Concept 50 (green).
Fig.7 Mission 770, step response on tweeter axis at 50" (5ms time window, 30kHz bandwidth).
Fig.8 Mission 770, cumulative spectral-decay plot on tweeter axis at 50" (0.15ms risetime).
The Mission 770's measured performance nicely correlated with its sonic character.—John Atkinson
Footnote 1: EPDR is the resistive load that gives rise to the same peak dissipation in an amplifier's output devices as the loudspeaker. See "Audio Power Amplifiers for Loudspeaker Loads," JAES, Vol.42 No.9, September 1994, and stereophile.com/reference/707heavy/index.html.