
Fig.3 plots the small-signal THD+noise percentage against frequency. This result is typical of well-designed solid-state amplifiers. The 1kHz, THD+noise waveform at an output of 40W into 4 ohms is shown in fig.4. (The distortion is largely obscured by noise at the lower power readings we usually use for this measurement.) The second harmonic dominates, but the waveform's slight triangularity indicates the presence of higher-order harmonics. This is more pronounced into a 2 ohm load, less so into 8 ohms. (Neither of the latter is shown.) 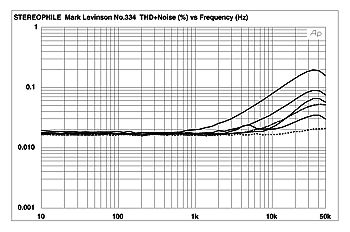 Fig.3 Mark Levinson No.334, THD+noise (%) vs frequency at (from top to bottom at 10kHz): 4W into 2 ohms, 2W into 4 ohms, 1W into 8 ohms, and 2.83V into simulated loudspeaker load (right channel dashed).
 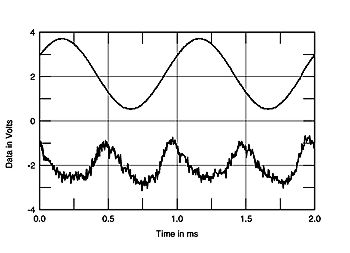 Fig.4 Mark Levinson No.334, 1kHz waveform at 40W into 4 ohms (top), distortion and noise waveform with fundamental notched out (bottom, not to scale).
The distortion spectrum resulting from a 50Hz input at 167.5W into 4 ohms is shown in fig.5. All artifacts are below -80dB (0.01%), an excellent result. Fig.6 shows the 19+20kHz intermodulation spectrum at 67.7W into 4 ohms. (Visible signs of clipping start to appear at higher levels with this signal.) The highest-level artifact is -72dB (about 0.025%) at 18kHz. At 125.5W into 4 ohms (not shown), the IM distortion is lower: a maximum of -77.3dB (about 0.014%) at 18kHz.
Fig.4 Mark Levinson No.334, 1kHz waveform at 40W into 4 ohms (top), distortion and noise waveform with fundamental notched out (bottom, not to scale).
The distortion spectrum resulting from a 50Hz input at 167.5W into 4 ohms is shown in fig.5. All artifacts are below -80dB (0.01%), an excellent result. Fig.6 shows the 19+20kHz intermodulation spectrum at 67.7W into 4 ohms. (Visible signs of clipping start to appear at higher levels with this signal.) The highest-level artifact is -72dB (about 0.025%) at 18kHz. At 125.5W into 4 ohms (not shown), the IM distortion is lower: a maximum of -77.3dB (about 0.014%) at 18kHz. 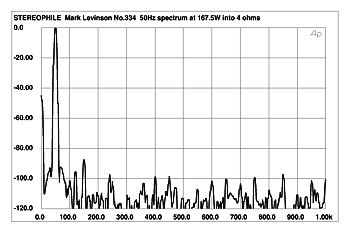 Fig.5 Mark Levinson No.334, spectrum of 50Hz sinewave, DC-1kHz, at 167.5W into 4 ohms (linear frequency scale).
 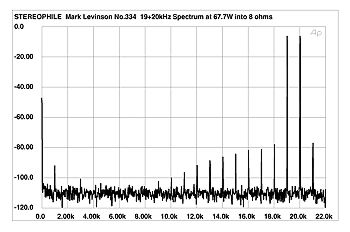 Fig.6 Mark Levinson No.334, HF intermodulation spectrum, DC-22kHz, 19+20kHz at 67.7W into 8 ohms (linear frequency scale).
Fig.3 Mark Levinson No.334, THD+noise (%) vs frequency at (from top to bottom at 10kHz): 4W into 2 ohms, 2W into 4 ohms, 1W into 8 ohms, and 2.83V into simulated loudspeaker load (right channel dashed). Fig.4 Mark Levinson No.334, 1kHz waveform at 40W into 4 ohms (top), distortion and noise waveform with fundamental notched out (bottom, not to scale). Fig.5 Mark Levinson No.334, spectrum of 50Hz sinewave, DC-1kHz, at 167.5W into 4 ohms (linear frequency scale). Fig.6 Mark Levinson No.334, HF intermodulation spectrum, DC-22kHz, 19+20kHz at 67.7W into 8 ohms (linear frequency scale).