Because of the Klipsch La Scala's bulk—it weighs 201lb—I measured the speaker in AH's apartment. I used DRA Labs' MLSSA system and a calibrated DPA 4006 microphone to measure the La Scala's behavior in the farfield, and an Earthworks QTC-40 mike for the nearfield and in-room responses. The loudspeakers were driven by the Manley Mahi Mahi amplifiers AH used for his auditioning. For the measurements, I left off the grille that covers the high-frequency and midrange horns, as AH preferred the sound without them.
The La Scala's sensitivity is specified as an extraordinarily high 105dB/2.83V/m, which is the same specification as the Klipschorn AK6 that the late Art Dudley reviewed in September 2019. As with the AK6, my B-weighted estimate was lower, at 101.3dB(B)/2.83V/m, but this is still the second-highest sensitivity of all the speakers I have measured and almost 19dB higher than the sensitivity of the BBC LS3/5a I always measure at the same time I test a speaker (to ensure that I haven't made an error in setup). This speaker will play loudly even with a flea-powered amplifier driving it.
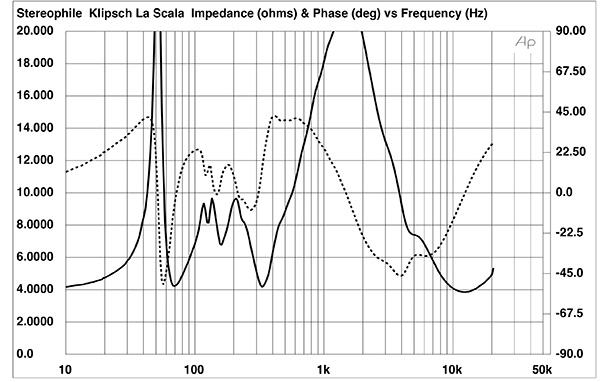
Klipsch specifies the La Scala's nominal impedance as "8 ohms compatible." However, the speaker's impedance magnitude (fig.1, solid trace) drops to 4.23 ohms at 70Hz and 4.17 ohms at 335Hz, and the electrical phase angle (dotted trace) is sometimes high. The equivalent peak dissipation resistance, or EPDR (footnote 1), drops below 3 ohms between 10Hz and 40Hz, 58Hz and 93Hz, 325Hz and 490Hz, and 4kHz and 11.5kHz. The minimum EPDR values are 2.1 ohms at 63Hz and 8kHz and 1.9 ohms at 372Hz. The La Scala will work best with amplifiers that are not fazed by 4 ohm loads, but the need for current will be alleviated by the Klipsch's very high sensitivity.
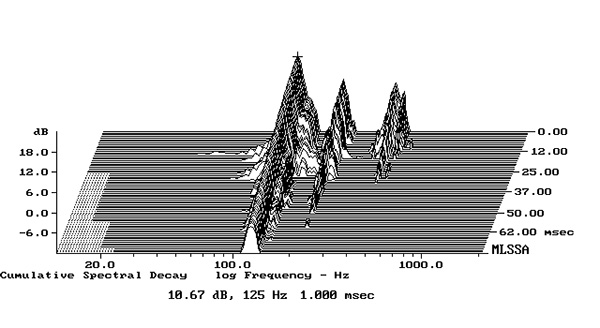
The treble and bass enclosures' side and rear panels sounded lively when I rapped them with my knuckles, so I investigated the panels' vibrational behavior with a plastic-tape accelerometer. While the treble enclosure was free from resonances in the midrange, where they might have had an audible effect with music, I found three fairly strong resonant modes on the sides of the bass bin (fig.2). The highest was at 125Hz.
Usually when I measure a loudspeaker's farfield behavior, I raise it as far as possible off the ground. This moves the reflections from the floor back in time and increases the resolution of the FFT-derived responses in the midrange. (The FFT is applied to the portion of the impulse response before the first reflection of the sound.) However, even with AH's help I couldn't lift the La Scala off the floor onto a stand, so to increase the effective analysis time window, I measured the farfield behavior at 1m rather than my usual 50".
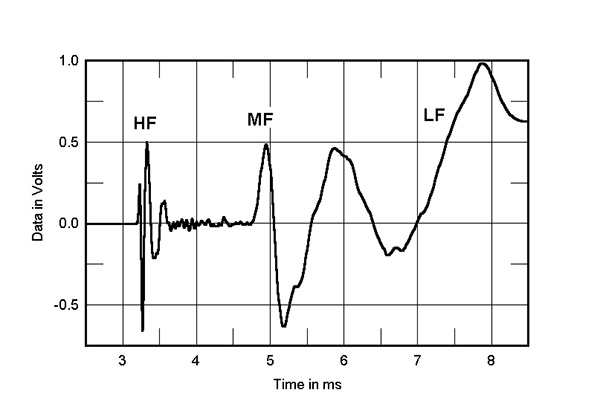
I then had to deal with another issue. As with the Klipschorn AK6, when a loudspeaker uses horn-loaded drive units, but the horn openings are all in the same plane, the outputs of the drive units arrive at the microphone or the listener's ears at different times due to the different lengths of the horns. This can be seen in fig.3, which shows the La Scala's step response on the tweeter axis. All three drive units are connected in positive acoustic polarity, but the tweeter's output arrives first at the microphone. The output of the midrange unit doesn't arrive at the microphone for another 1.5ms, while the woofer's output starts to arrive 2ms after that. Although the arrivals of all three horn outputs are within the ear's tolerance for arrival time difference (footnote 2), such behavior could interfere somewhat with stereo imaging precision.
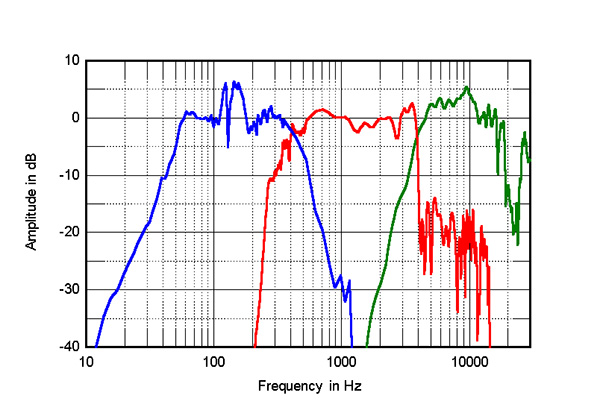
The La Scala's impedance-magnitude plot has a single peak in the bass centered at 52Hz, suggesting that this is the drive unit's fundamental tuning frequency. Klipsch specifies the speaker's low-frequency extension as –4dB at 51Hz, which was confirmed by a nearfield measurement (fig.4, blue trace): The woofer's output rolls off below that frequency. I also saw peaks in the woofer's output in the octave between 100Hz and 200Hz. The woofer crosses over to the midrange unit (fig.4, red trace) close to the specified 450Hz, with a relatively sharp upper-frequency rolloff.
The midrange unit rolls in quickly, and while its farfield output (fig.4, red trace) has a touch too much energy in the upper midrange and close to 3kHz, its balance is relatively even. Although the tweeter does not have a separate input, because of the arrival time differences seen in fig.3, I could perform separate high-frequency FFT analyses for the midrange unit and the tweeter. The red trace above 3kHz in fig.4 shows the midrange unit's response calculated in that manner, while the green trace shows that of the tweeter. The upper-frequency crossover appears to occur at 4kHz rather than the specified 4.5kHz, and the tweeter appears to be balanced approximately 3dB too high in level before it rolls off quickly above 19kHz.

Fig.5 shows the farfield response of the La Scala's upper enclosure averaged across a 30° horizontal window centered on the tweeter axis. The tweeter still appears to be too high in level compared to the midrange unit's top-octave response, and there are some sharply defined suckouts at the top of the midrange unit's output. Note that I didn't connect the woofer for this measurement, as its output was corrupted by the reflections from the floor.
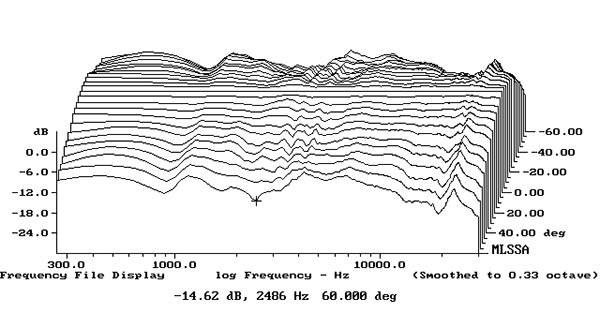
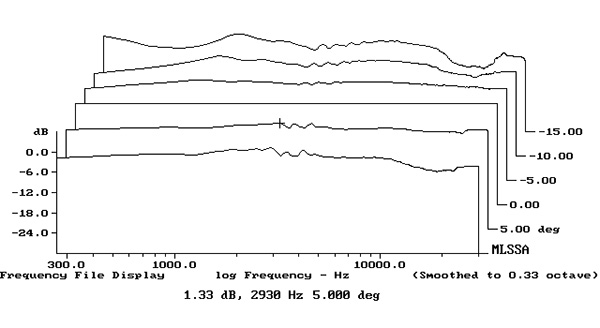
For the same reason, the plot of the La Scala's horizontal dispersion (fig.6), normalized to the response on the tweeter axis, shows just that of the midrange/treble enclosure. (As the graph with my usual 1/10-octave smoothing was too complicated to easily see what was happening off-axis, I used 1/3-octave smoothing.) The speaker's horizontal dispersion is relatively uniform with frequency and gently falls off to the speaker's sides. In the vertical plane (fig.7), the response on the tweeter axis, which is 38" from the floor, is maintained over a ±5° window.
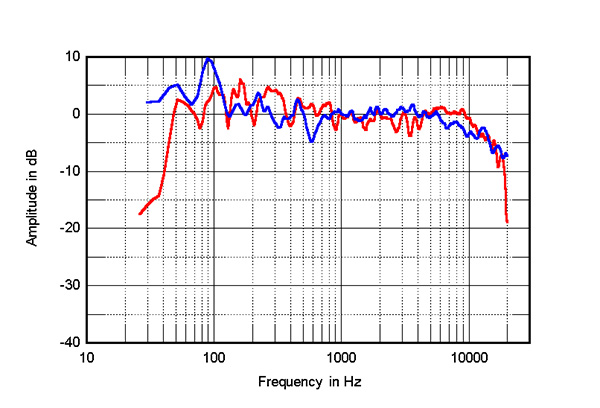
The red trace in fig.8 shows the Klipsch's spatially averaged response in AH's room. To generate this graph, I average 20 1/10-octave–smoothed responses taken individually for the left and right speakers in a vertical rectangular window centered on the position of the listener's ears. The averaging tends to minimize the effect of room resonances on the measured response below 400Hz. For reference, the blue trace in this graph shows the spatially averaged response, taken in the identical manner, of the JBL 4367, which AH reviewed in May 2022. The traces are adjusted to be equal in level at 1kHz, but it should be noted that the JBL's measured sensitivity, though high, is 10.6dB lower than the Klipsch's. The La Scala has a little more output than the JBL in the top two octaves and the lower midrange, but its low frequencies are in better balance, despite the speakers being in very similar positions in the room. As expected from its nearfield response (shown in fig.4), the La Scala's low frequencies roll off in-room below 50Hz.
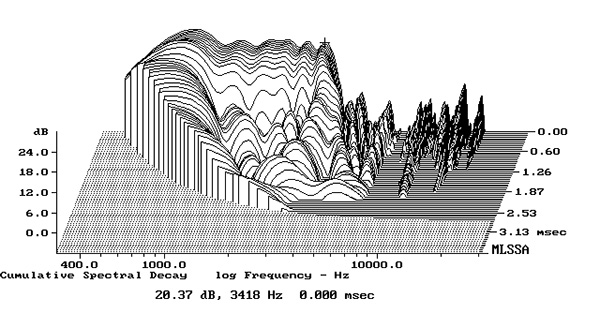
The differences in arrival times of the three drive-unit outputs make a conventional cumulative spectral-decay or waterfall plot very difficult to interpret. However, the different arrival times make it possible to calculate individual waterfall plots. The tweeter's waterfall plot (not shown) revealed a clean initial delayed energy, with some ridges of delayed energy at the top of its passband. Fig.9 shows the midrange unit's waterfall plot. It is fairly clean, though a ridge of delayed energy is visible just before it crosses over to the tweeter. Several energy spikes are visible above the crossover frequency, but these are low in level.
The La Scala's measured behavior is complicated, but from my experience listening to music in AH's room, its balance is more neutral than I was expecting. And I remain astonished by that high sensitivity. Even though I had MLSSA's output set to its lowest level when I performed the measurements, the sound was very loud. I was concerned that AH's neighbors would eventually be knocking on his door to complain!—John Atkinson
Footnote 1: EPDR is the resistive load that gives rise to the same peak dissipation in an amplifier's output devices as the loudspeaker. See "Audio Power Amplifiers for Loudspeaker Loads," JAES, Vol.42 No.9, September 1994, and stereophile.com/reference/707heavy/index.html.
Footnote 2: See https://en.wikipedia.org/wiki/Precedence_effect.


