| Columns Retired Columns & Blogs |
Epos ES 14 loudspeaker Measurements part 2
In the time domain, the Epos's impulse response (fig.8) is dominated by the ultrasonic tweeter ringing. This can also be seen on the associated step response (fig.9), which reveals both that the tweeter and woofer are connected with the same acoustic polarity, and that the former leads the latter a little in time, as is always the case with speakers with flat vertical baffles. Simple crossovers do not in themselves confer time coherency on a speaker; the drive-unit acoustic centers must also be the same distance from the listener/microphone.
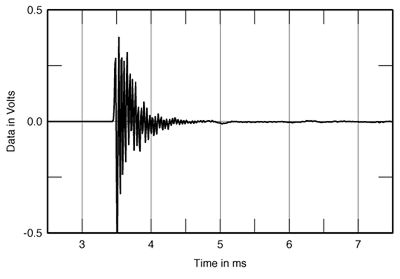
Fig.8 Epos ES 14, impulse response on tweeter axis at 45" (5ms time window, 30kHz bandwidth).
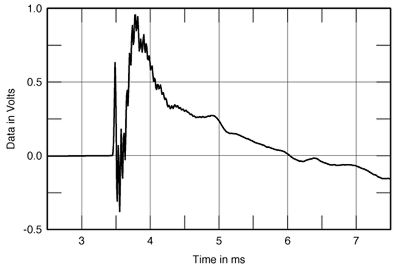
Fig.9 Epos ES 14, step response on tweeter axis at 45" (5ms time window, 30kHz bandwidth).
Fig.10 shows the cumulative spectral-decay, or waterfall, plot calculated from the impulse response data. This is relatively clean, though resonant modes can be seen just under 2kHz and at 3kHz, these presumably due to the woofer cone misbehaving. The big peak at 25kHz is our old friend, the tweeter's "oil-can" dome resonance—it won't be audible unless it's so intense that intermodulation products fold down into the audioband. As I noted, I was occasionally disturbed by what sounded like high-frequency modulation noise on transient-rich analog program without much psychoacoustic masking—piano recordings, as the lay person would call it. Perhaps this could be laid at the feet of the tweeter.
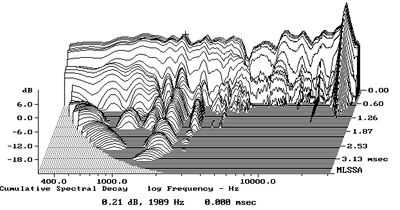
Fig.10 Epos ES 14, cumulative spectral-decay plot at 45" (0.15ms risetime).
I mentioned earlier that the impedance traces hinted at a cabinet resonance in the 350Hz region. Calculating waterfall plots from the output of a simple plastic-film accelerometer taped to the cabinet panels reveals there to be just one identifiable resonance at 360Hz, this fairly strong on the side panels (fig.11) but much less so on the top and back panels. This is quite a high frequency for a speaker the size of the ES 14, implying that the speaker's internal bracing/tensioning rod is doing its job.—John Atkinson
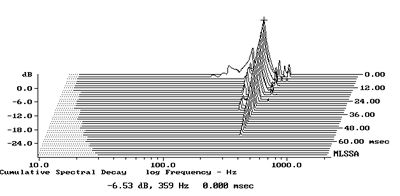
Fig.11 Epos ES 14, cumulative spectral-decay plot of accelerometer output fastened to center of enclosure side panel halfway up from the base. (MLS driving voltage to speaker, 7.55V; measurement bandwidth, 2kHz.)
- Log in or register to post comments
