Sidebar 3: Measurements
I examined the Bryston 7B SST2's measured behavior using mainly Stereophile's loaner sample of the top-of-the-line Audio Precision SYS2722 system (see the January 2008 "As We See It" and www.ap.com); for some tests, I also used my vintage Audio Precision System One Dual Domain.
Before performing any tests on an amplifier, I run it for 60 minutes at one-third its specified power into 8 ohms, which is thermally the worst case for an amplifier with a class-B or -AB output stage. The Bryston's chassis and heatsinks were way too hot to touch after 30 minutes of running at this power level, though after the full hour I could still keep my hand on the front panel, implying a temperature of about 131°F (55°C). Clearly, the 7B SST2 has enough heatsink capacity for sustained high-power use.
The Bryston's voltage gain into 8 ohms was 29dB when the amplifier was set to "1V" sensitivity, 22.9dB when set to "2V," these figures the same for both balanced and unbalanced drive. Both sets of inputs preserved absolute polarity (ie, were non-inverting), the XLR jack being wired with pin 2 hot. The balanced input impedance was 10k ohms across the audioband; the unbalanced stayed close to a moderately low 7.5k ohms at low and middle frequencies, dropping a little, to 7.2k ohms, at 20kHz. This would not have been a problem for the unbalanced outputs of MF's darTZeel preamplifier, which is what he used for the auditioning, but the Bryston's balanced input is incompatible with the darTZeel's balanced output, which has an atypically high source impedance that varies with frequency.
The Bryston's output impedance was low for a balanced design, at 0.11 ohm at low and middle frequencies, rising slightly to 0.17 ohm at 20kHz. As a result, the modification of the amplifier's frequency response due to the Ohm's Law interaction between its source impedance and that of the speaker will be small. With our simulated loudspeaker, the variations in response remained within ±0.1dB limits (fig.1, gray trace). The amplifier's response into 8 ohms didn't reach –3dB until almost 200kHz (fig.1, blue), which correlates with the well-defined 10kHz squarewave response (fig.2). The 7B SST2's output does start to fall slightly above 10kHz into lower impedances; into 2 ohms (fig.1, red), the output at 20kHz is down 0.4dB, though this will have no subjective consequences.
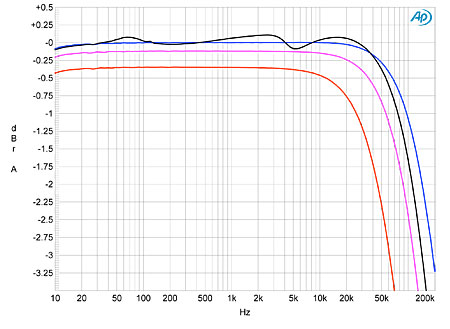 Fig.1 Bryston 7B SST2, frequency response at 2.83V into: simulated loudspeaker load (gray), 8 ohms (blue), 4 ohms (magenta), 2 ohms (red). (1dB/vertical div.)
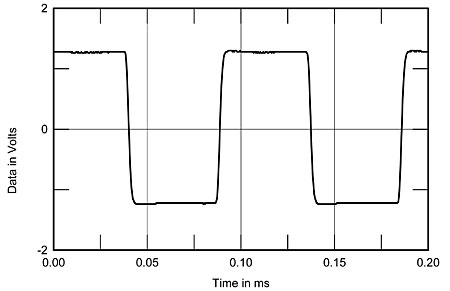 Fig.2 Bryston 7B SST2, small-signal 10kHz squarewave into 8 ohms.
The 7B SST2 is a quiet amplifier. Its unweighted signal/noise ratio (ref. 1W into 8 ohms) measured 75.6dB, this improving to 92dB with the measurement bandwidth restricted to the audioband, and to 95.7dB when A-weighted. These figures were in the low-gain setting; the high-gain performance was approximately 3dB worse. Fig.3 plots the percentage of THD+noise in the Bryston's output against power. The downward slope of the plots below 10W implies that what distortion is present is buried beneath the noise. Only into 2 ohms does the amplifier's THD start to rise above the noise at relatively low powers, but even then it remains less than 0.01% below actual waveform clipping. The Bryston's maximum power delivery is specified at 600W into 8 ohms (27.8dBW); the traces in fig.3 indicate that at clipping (defined as 1% THD+N), the amplifier puts out 632W into 8 ohms (28dBW), 930W into 4 ohms (26.7dBW), but 690W into 2 ohms (22.4dBW).
Fig.2 Bryston 7B SST2, small-signal 10kHz squarewave into 8 ohms.
The 7B SST2 is a quiet amplifier. Its unweighted signal/noise ratio (ref. 1W into 8 ohms) measured 75.6dB, this improving to 92dB with the measurement bandwidth restricted to the audioband, and to 95.7dB when A-weighted. These figures were in the low-gain setting; the high-gain performance was approximately 3dB worse. Fig.3 plots the percentage of THD+noise in the Bryston's output against power. The downward slope of the plots below 10W implies that what distortion is present is buried beneath the noise. Only into 2 ohms does the amplifier's THD start to rise above the noise at relatively low powers, but even then it remains less than 0.01% below actual waveform clipping. The Bryston's maximum power delivery is specified at 600W into 8 ohms (27.8dBW); the traces in fig.3 indicate that at clipping (defined as 1% THD+N), the amplifier puts out 632W into 8 ohms (28dBW), 930W into 4 ohms (26.7dBW), but 690W into 2 ohms (22.4dBW).
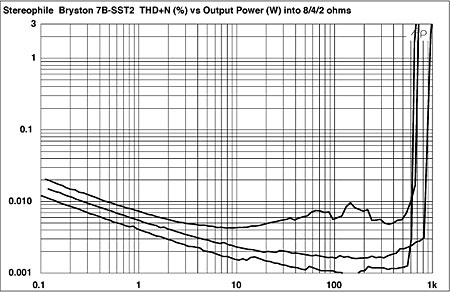 Fig.3 Bryston 7B SST2, distortion (%) vs 1kHz continuous output power into (from bottom to top): 8, 4, 2 ohms.
I examined how the Bryston's THD+N percentage changed with frequency at a level of 14V, or 24.5W into 8 ohms, where the distortion was starting to emerge from the background noise (fig.4). The THD starts to rise above 1kHz, more so into 4 ohms (magenta) than into 8 ohms (blue), due to the falling amount of open-loop gain margin reducing the effectiveness of the negative-feedback mojo. The amplifier is clearly less comfortable into 2 ohms (red); even so, the absolute distortion levels remain very low at all frequencies.
Fig.3 Bryston 7B SST2, distortion (%) vs 1kHz continuous output power into (from bottom to top): 8, 4, 2 ohms.
I examined how the Bryston's THD+N percentage changed with frequency at a level of 14V, or 24.5W into 8 ohms, where the distortion was starting to emerge from the background noise (fig.4). The THD starts to rise above 1kHz, more so into 4 ohms (magenta) than into 8 ohms (blue), due to the falling amount of open-loop gain margin reducing the effectiveness of the negative-feedback mojo. The amplifier is clearly less comfortable into 2 ohms (red); even so, the absolute distortion levels remain very low at all frequencies.
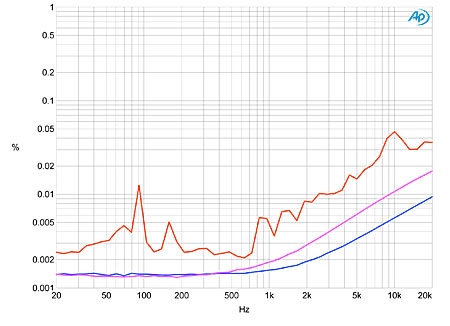 Fig.4 Bryston 7B SST2, THD+N (%) vs frequency at 14V into: 8 ohms (blue), 4 ohms (magenta), 2 ohms (red).
More important, fig.5 reveals that the distortion spectrum consists almost entirely of subjectively innocuous low-order components, though a comparison of the spectra at high power into 8 ohms (fig.6) and 4 ohms (fig.7) indicates that the third harmonic rises as the output current increases. Note, however, the very low level of AC supply spuriae in these graphs. The 7B SST2's power supply is clearly more than adequate for the high powers this amplifier is designed to deliver. Finally, when tested at close to clipping into 4 ohms with the demanding combination of 19 and 20kHz tones, the Bryston's output spectrum (fig.8) was more like that of a preamplifier, with all intermodulation products at or below –100dB (0.001%).
Fig.4 Bryston 7B SST2, THD+N (%) vs frequency at 14V into: 8 ohms (blue), 4 ohms (magenta), 2 ohms (red).
More important, fig.5 reveals that the distortion spectrum consists almost entirely of subjectively innocuous low-order components, though a comparison of the spectra at high power into 8 ohms (fig.6) and 4 ohms (fig.7) indicates that the third harmonic rises as the output current increases. Note, however, the very low level of AC supply spuriae in these graphs. The 7B SST2's power supply is clearly more than adequate for the high powers this amplifier is designed to deliver. Finally, when tested at close to clipping into 4 ohms with the demanding combination of 19 and 20kHz tones, the Bryston's output spectrum (fig.8) was more like that of a preamplifier, with all intermodulation products at or below –100dB (0.001%).
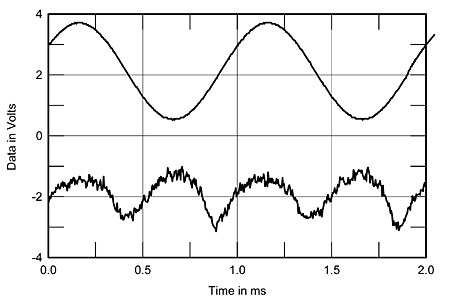 Fig.5 Bryston 7B SST2, 1kHz waveform at 196W into 4 ohms (top), 0.0019% THD+N; distortion and noise waveform with fundamental notched out (bottom, not to scale).
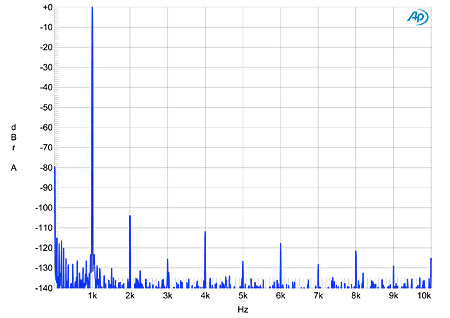 Fig.6 Bryston 7B SST2, spectrum of 1kHz sinewave, DC–10kHz, at 196W into 8 ohms (linear frequency scale).
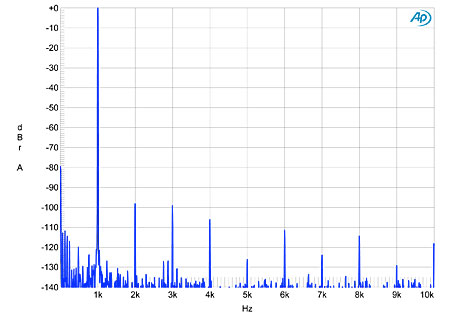 Fig.7 Bryston 7B SST2, spectrum of 1kHz sinewave, DC–10kHz, at 382W into 4 ohms (linear frequency scale).
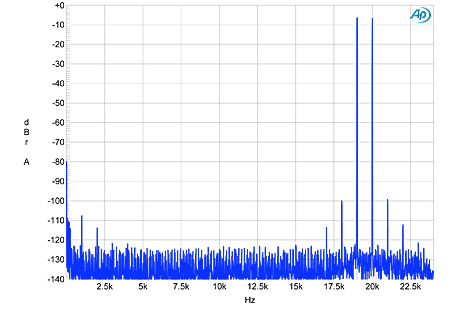 Fig.8 Bryston 7B SST2, HF intermodulation spectrum, DC–24kHz, 19+20kHz at 400W peak into 4 ohms (linear frequency scale).
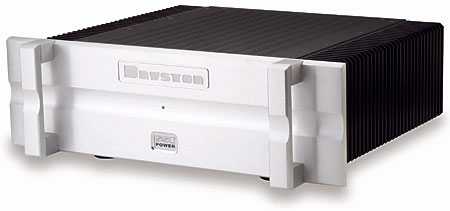
As is usual with Bryston amplifiers, the 7B SST2 offers textbook measured performance and usefully high power.—John Atkinson
Fig.8 Bryston 7B SST2, HF intermodulation spectrum, DC–24kHz, 19+20kHz at 400W peak into 4 ohms (linear frequency scale).
As is usual with Bryston amplifiers, the 7B SST2 offers textbook measured performance and usefully high power.—John Atkinson
Fig.1 Bryston 7B SST2, frequency response at 2.83V into: simulated loudspeaker load (gray), 8 ohms (blue), 4 ohms (magenta), 2 ohms (red). (1dB/vertical div.)
Fig.2 Bryston 7B SST2, small-signal 10kHz squarewave into 8 ohms.
The 7B SST2 is a quiet amplifier. Its unweighted signal/noise ratio (ref. 1W into 8 ohms) measured 75.6dB, this improving to 92dB with the measurement bandwidth restricted to the audioband, and to 95.7dB when A-weighted. These figures were in the low-gain setting; the high-gain performance was approximately 3dB worse. Fig.3 plots the percentage of THD+noise in the Bryston's output against power. The downward slope of the plots below 10W implies that what distortion is present is buried beneath the noise. Only into 2 ohms does the amplifier's THD start to rise above the noise at relatively low powers, but even then it remains less than 0.01% below actual waveform clipping. The Bryston's maximum power delivery is specified at 600W into 8 ohms (27.8dBW); the traces in fig.3 indicate that at clipping (defined as 1% THD+N), the amplifier puts out 632W into 8 ohms (28dBW), 930W into 4 ohms (26.7dBW), but 690W into 2 ohms (22.4dBW).
Fig.3 Bryston 7B SST2, distortion (%) vs 1kHz continuous output power into (from bottom to top): 8, 4, 2 ohms.
I examined how the Bryston's THD+N percentage changed with frequency at a level of 14V, or 24.5W into 8 ohms, where the distortion was starting to emerge from the background noise (fig.4). The THD starts to rise above 1kHz, more so into 4 ohms (magenta) than into 8 ohms (blue), due to the falling amount of open-loop gain margin reducing the effectiveness of the negative-feedback mojo. The amplifier is clearly less comfortable into 2 ohms (red); even so, the absolute distortion levels remain very low at all frequencies.
Fig.4 Bryston 7B SST2, THD+N (%) vs frequency at 14V into: 8 ohms (blue), 4 ohms (magenta), 2 ohms (red).
Fig.5 Bryston 7B SST2, 1kHz waveform at 196W into 4 ohms (top), 0.0019% THD+N; distortion and noise waveform with fundamental notched out (bottom, not to scale).
Fig.6 Bryston 7B SST2, spectrum of 1kHz sinewave, DC–10kHz, at 196W into 8 ohms (linear frequency scale).
Fig.7 Bryston 7B SST2, spectrum of 1kHz sinewave, DC–10kHz, at 382W into 4 ohms (linear frequency scale).
Fig.8 Bryston 7B SST2, HF intermodulation spectrum, DC–24kHz, 19+20kHz at 400W peak into 4 ohms (linear frequency scale).
As is usual with Bryston amplifiers, the 7B SST2 offers textbook measured performance and usefully high power.—John Atkinson