Sidebar 3: Measurements
The Aurorasound HFSA-01 was shipped to me with the four Sovtek EL84/6BQ5 tubes installed. I removed the small lid on top of the chassis to make sure the tubes were correctly seated, then performed a complete set of tests with my Audio Precision SYS2722 system. To check whether some of the results were due to aging or to out-of-spec tubes, I installed a matched set of new TubeDepot JJ EL84s then repeated the testing.
Looking first at the line inputs, the HFSA-01 preserved polarity from both the 4 ohm and 8 ohm output transformer taps and from the headphone output on the front panel. The input impedance was a usefully high 31k ohms at 20Hz and 1kHz, dropping inconsequentially to 28k ohms at 20kHz. With the volume control set to its maximum and with both sets of tubes, the voltage gain into 8 ohms was 30.76dB from the 8 ohm tap, 29dB from the 4 ohm tap, and 21dB from the headphone output.
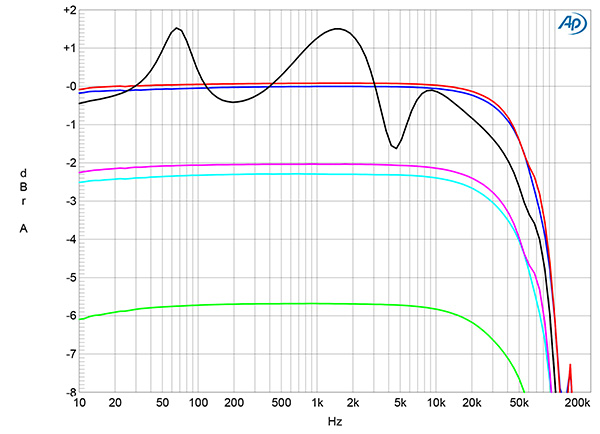
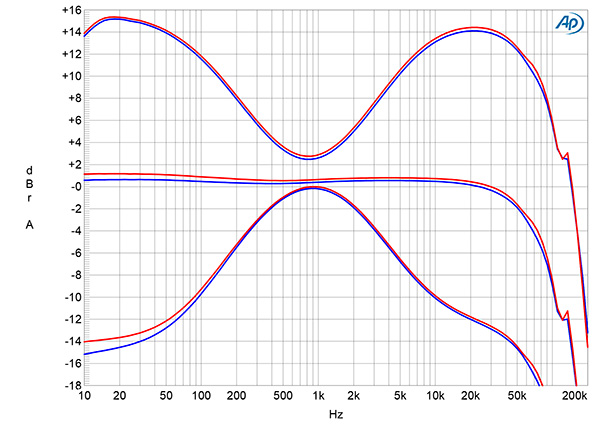
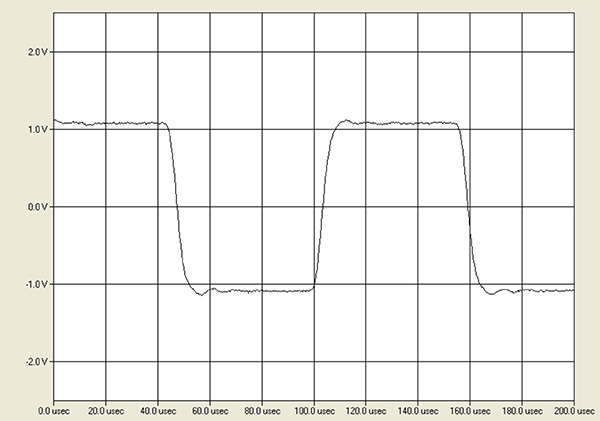
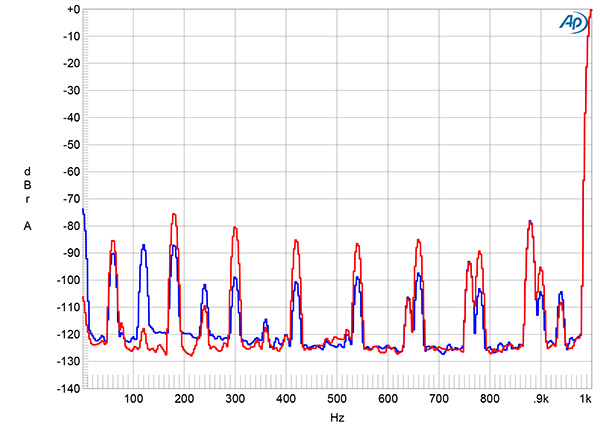
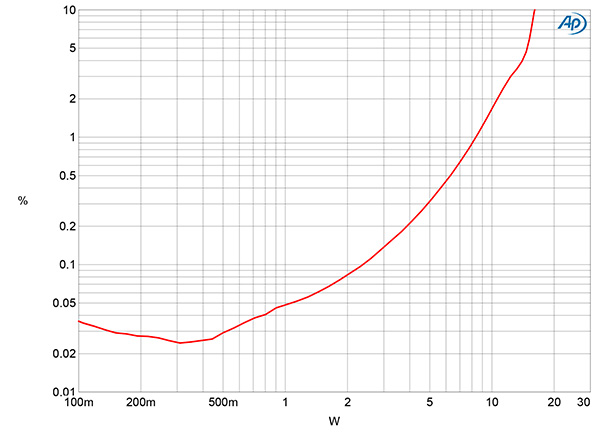
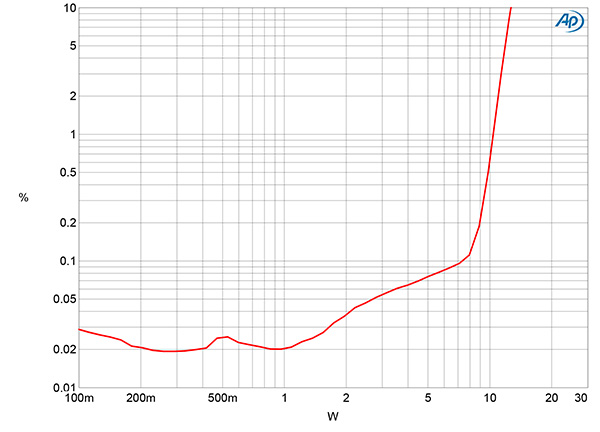
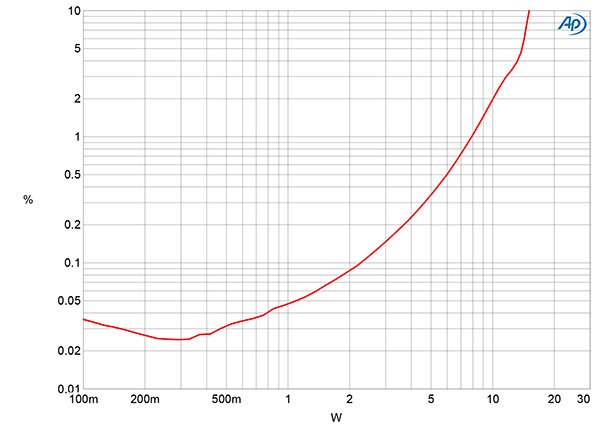
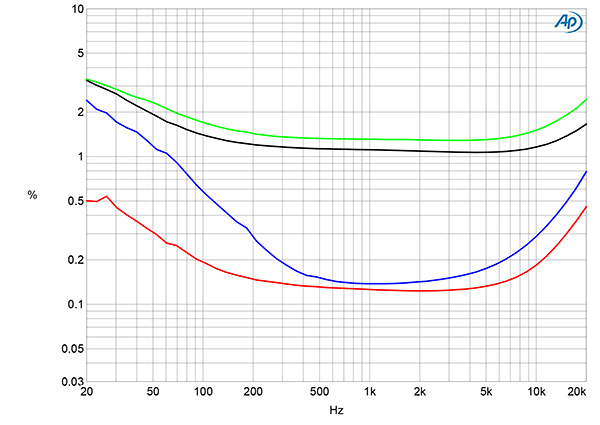
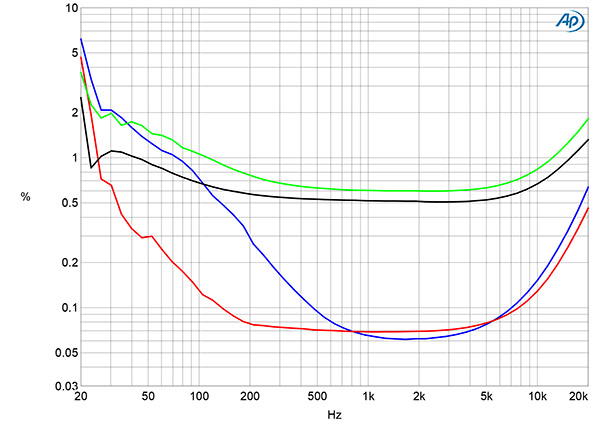
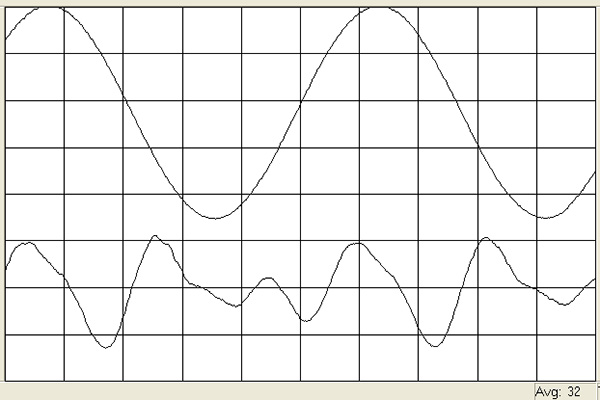
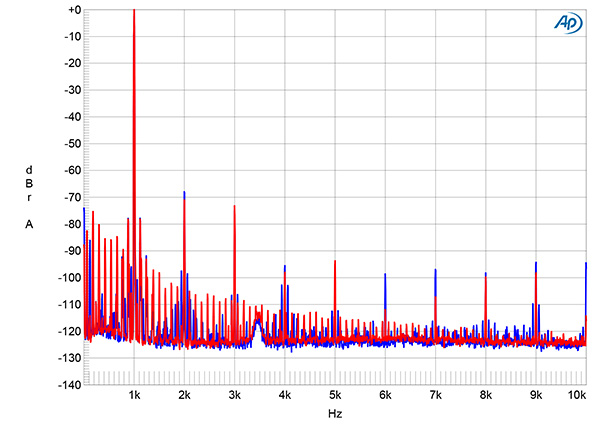
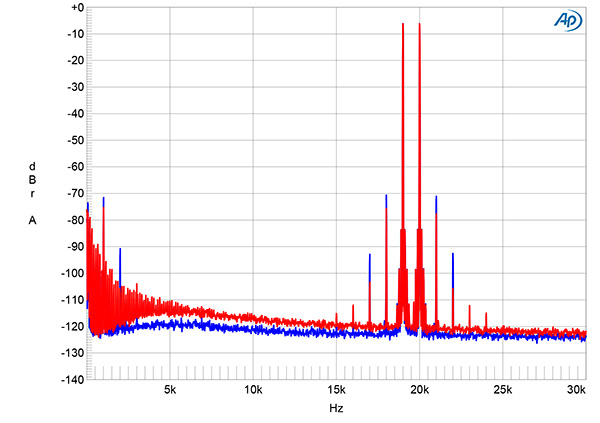
Fig.1 Aurorasound HFSA-01, 8 ohm output tap, frequency response at 2.83V into: simulated loudspeaker load (right channel, gray), 8 ohms (left channel blue, right red), 4 ohms (left cyan, right magenta), and 2 ohms (green) (1dB/vertical div.).
The headphone output's source impedance was 9.75 ohms in the bass and midrange, 9.2 ohms at the top of the audioband. The output impedance from the 8 ohm transformer taps was a relatively high 2.65 ohms at 20Hz and 1kHz, rising to 2.95 ohms at 20kHz, again with both EL84 types. As a result, the variation in the frequency response with our standard simulated loudspeaker (fig.1, gray trace), due to the Ohm's Law interaction between the source impedance and that of the load, was an audible ±1.7dB. From the 4 ohm taps, the output impedance was 1.5 ohms at 20Hz and 1kHz, 1.7 ohms at 20kHz, and the response variation with the simulated loudspeaker was lower, at ±1dB (not shown). The response into 8 ohms (fig.1, blue and red traces) was flat in the audioband and rolled off above 20kHz, reaching –3dB at 75kHz. Fig.1 was taken with the volume control set to its maximum; note the excellent channel matching. However, at lower control settings, the left channel's level was up to 0.4dB lower than that of the right (see later).
Fig.2 Aurorasound HFSA-01, 8 ohm output tap, response at 500mW into 8 ohms with treble and bass controls off and set to the maximum and minimum (left channel blue, right red; 5dB/vertical div.).
Fig.3 Aurorasound HFSA-01, 8 ohm output tap, small-signal 10kHz squarewave into 8 ohms.
The treble and bass controls are specified as offering boosts and cuts of up to 12dB. However, fig.2 show that the actual changes in level are closer to ±14dB. The small peak at 134kHz in the response traces correlates with a small amount of overshoot on the leading edges of the Aurorasound's reproduction of a 10kHz squarewave into 8 ohms, coupled with some damped ringing (fig.3). The HFSA-01's channel separation (not shown) was very good, at >80dB in both directions below 3kHz and still 72dB, R–L, and 80dB, L–R, at the top of the audioband.
Fig.4 Aurorasound HFSA-01, 8 ohm output tap, spectrum of 1kHz sinewave, DC–1kHz, at 1Wpc into 8 ohms with volume control set to its maximum (left channel blue, right red; linear frequency scale).
The unweighted, wideband signal/noise ratio (ref. 1W into 8 ohms), taken from the 8 ohm taps with the inputs shorted to ground and the volume control set to its maximum, was 77.7dB in the left channel, 71.3dB in the right. These ratios were slightly higher when the measurement bandwidth was restricted to 22Hz–22kHz, but increased to 89.3dB, left, and 78.8dB, right, when A-weighted. With their lower gain, the ratios from the 4 ohm outputs were 2dB better. Spectral analysis of the low-frequency noisefloor while the Aurorasound's 8 ohm taps drove a 1kHz tone at 1Wpc into 8 ohms with the volume control set to the maximum (fig.4) revealed relatively high levels of power supply–related spuriae in both channels. The spuriae at 60Hz and its odd-order harmonics are due to magnetic interference from the power transformer possibly being picked up by the steel pins of the output tubes. Supporting this hypothesis, repeating the spectral analysis at the same output level but with the volume control set to –20dB didn't change the level of the spuriae, which therefore must be introduced in the output stage.
Fig.5 Aurorasound HFSA-01, 8 ohm output tap, distortion (%) vs 1kHz continuous output power into 8 ohms.
Fig.6 Aurorasound HFSA-01, 4 ohm output tap, distortion (%) vs 1kHz continuous output power into 8 ohms.
Fig.7 Aurorasound HFSA-01, 4 ohm output tap, distortion (%) vs 1kHz continuous output power into 4 ohms.
Aurorasound specifies the HFSA-01's maximum power as 14Wpc into 8 ohms (11.46dBW). At our usual definition of clipping, which is when the THD+noise reaches 1%, the amplifier didn't meet the specification, clipping at 8.5W into 8 ohms from the 8 ohm tap (9.3dBW, fig.5) and at 10W into 8 ohms from the 4 ohm tap (10dBW, fig.6). Relaxing the clipping definition to 10% THD+N, the amplifier output 16W from the 8 ohm tap into 8 ohms (12dBW), 12.7W from the 4 ohm tap into 8 ohms (11.04dBW), and 15.1W from the 4 ohm tap into 4 ohms (8.8dBW, fig.7). These measurements were performed with the original EL84 tubes; repeating them with the JJ tubes resulted in slightly higher distortion at low powers but slightly higher power at the same THD+N percentages. For example, with the JJ tubes, the amplifier's 8 ohm tap delivered 17W into 8 ohms at 10% THD+N. The THD+N percentage is very low below 1W into 8 ohms from both output transformer taps, but as the distortion rises as the power increases, this suggests that the circuit has little loop negative feedback.
Fig.8 Aurorasound HFSA-01, 8 ohm output tap, THD+N (%) vs frequency at 4.9V into: 8 ohms (left channel blue, right red), 4 ohms (left green, right gray).
Fig.9 Aurorasound HFSA-01, 4 ohm output tap, THD+N (%) vs frequency at 4.9V into: 8 ohms (left channel blue, right red), 4 ohms (left green, right gray).
I examined how the percentage of THD+N from the 8 ohm tap varied with frequency at 4.9V, which is equivalent to 3W into 8 ohms and 6W into 4 ohms (fig.8). The THD+N into 8 ohms was low in the midrange but rose at the frequency extremes, more so at low frequencies in the left channel (blue trace) than the right (red trace). This behavior was identical with both types of EL84s and suggests that the left channel's output transformer core starts to saturate at lower currents than that of the right channel. Although the distortion into 8 ohms is higher at 20kHz than it is at 1kHz, the clipping power (10% THD+N) was similar at 15.8W (12dBW). The THD+N into 4 ohms from the 8 ohm tap was >1% in both channels. The behavior from the 4 ohm tap into 8 ohms and 4 ohms (fig.9) was similar to that from the 8 ohm tap, though the distortion was lower in level into both loads.
Fig.10 Aurorasound HFSA-01, 8 ohm output tap, 1kHz waveform at 5W into 8 ohms, 0.077% THD+N (top); distortion and noise waveform with fundamental notched out (bottom, not to scale).
Fig.11 Aurorasound HFSA-01, 8 ohm output tap, spectrum of 1kHz sinewave, DC–1kHz, at 1W into 8 ohms (left channel blue, right red; linear frequency scale).
Fig.12 Aurorasound HFSA-01, 8 ohm output tap, HF intermodulation spectrum, DC–30kHz, 19+20kHz at 1W peak into 8 ohms (left channel blue, right red; linear frequency scale).
The distortion waveform was predominantly the second and third harmonics (figs.10 and 11) with both sets of tubes. Intermodulation distortion with either tap driving an equal mix of 19 and 20kHz tones at 1W peak into 8 ohms was low in level (fig.12). The 1kHz difference product lay just below –70dB (0.03%), and the levels of the higher-order products at 18kHz and 21kHz were similar.—John Atkinson


